User Preferences
In this section of the application you will find configurable settings that allow you to tailor the SAS Enterprise Session Monitor user experience to be exactly how want it.
Chart Settings
Chart settings allows you customize ESM to your preference. Changes made here are saved locally in the browser cache and are applied only to you.
Max number of flags to display in search
It is possible to configure how many flags (Events and Tags) are displayed by default in the Tag and Event Quick search. Default is 200. The maximum is 500.
Session max mem axis (MB)
This setting controls the scale of the Y axis on the Session and Server graphs. This can be set manually to aid in visual comparison of scenarios, but can usually be left unchanged. 0 equals no limit. Default is 0.
Server chart max disk axis (MB/s)
This setting controls the scale of the Y axis on the Session and Server graphs. This can be set manually to aid in visual comparison of scenarios, but can usually be left unchanged. 0 equals no limit. Default is 0.
Session treemap point limit
In environments with large numbers of processes that can run concurrently or when performing full analyses over large timespans the treemaps can become large and resource intensive. This setting customizes the number of data points that can be processed. Default is 500.
Place flags on chart line
This is a cosmetic setting that dictates whether the flags are drawn on the X axis of the Session Portlet graph, or on the line itself. Default is unchecked.
Allow overlapping flags
When this option is enabled flags that occur either at the same time or within a very close period of time (depending on the data resolution) are stacked on top of each other to enable easier reading. Default is unchecked.
Successful jobs colour
The colour of the bar for a Job on the Jobs History Search charts that has completed successfully. Default is #115C08
Warning jobs colour
The colour of the bar for a Job on the Jobs History search charts that has completed with a warning. Default is #F0F002
Error jobs colour
The colour of the bar for a Job on the Jobs History search charts that has completed with an error. Default is #E60909
Unknown jobs colour
The colour of the bar for a Job on the Jobs History search charts that has completed with an unknown return code. Default is #BBBBBB
Hide dead sessions on the live view
In the live view, dead sessions can remain in the process list until the time period expires. Dead sessions are distinguished by being greyed out. This option hides dead sessions in the live view immediately. Default is unchecked.
Users in My Team
Here you can add userids to "Your team". Userids added here must match the userids that are displayed in the "user" field for the sessions list in the Live view.
Once team members have been applied here you can use the "apply team filter" option in the Process List on either the Live View or a Timespan to filter the sessions list to only include users who are in your team.
Dashboard portlets
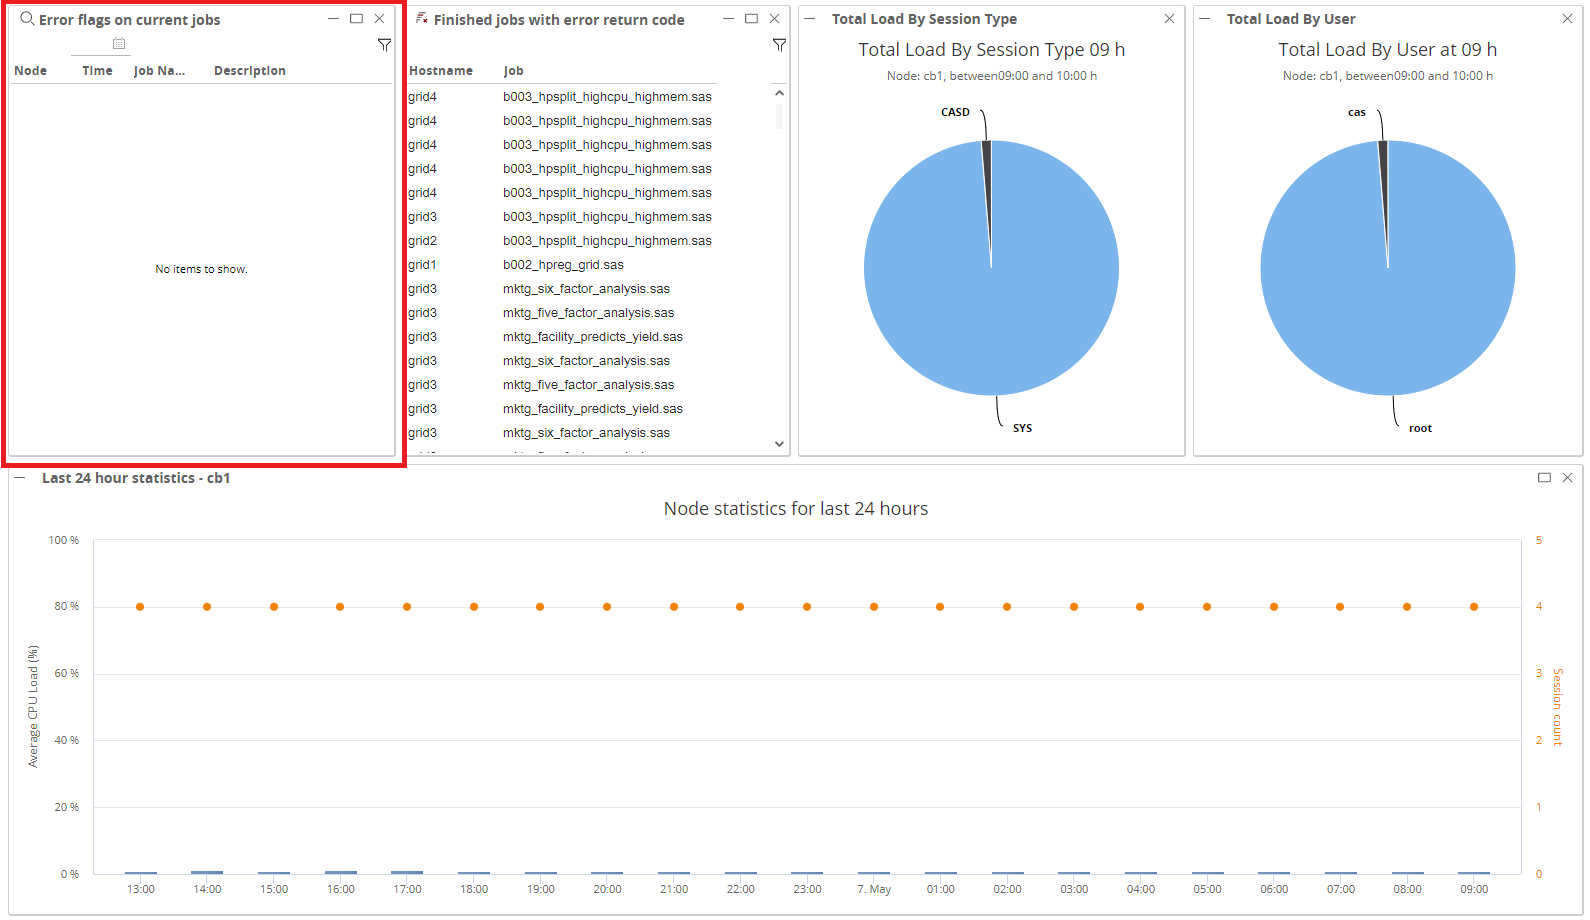
Recently Errored Jobs
Displays a portlet on the Dashboard showing the list of Jobs that have recently completed with errors. Clicking on the Job name takes you to the performance charts for that Job.
Language Settings
Displays the currently selected language for the user interface and provides a drop down selection for alternative languages.
Currently the only supported Language is English.
Jaeger Settings
Jaeger is a distributed tracing system released as open source by Uber Technologies. It is used for monitoring and troubleshooting microservices-based distributed systems, including:
- Distributed context propagation
- Distributed transaction monitoring
- Root cause analysis
- Service dependency analysis
- Performance / latency optimization
For more information about Jaeger, and how to configure it for your environment please use the official Jaeger documentation.
In the Jaeger Settings section a user can change the default base URL for Jaeger. By default the Jaeger base URL is set to http://localhost:16686.
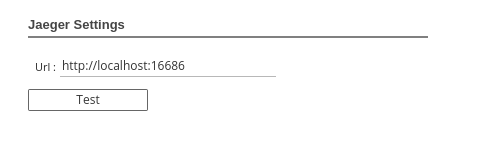
The "Test" button allows the user to test whether the base URL provided resolves to the homepage of Jaeger. If Jaeger is running on the base URL provided, a dialog with the Jaeger home screen will be shown:

If the Jaeger UI is not running on the URL provided, the dialog should show the following:
![]()
Flags per session limit
The maximum number of events (Spans, Tags, and Log Events) that can be displayed when viewing a session.
Application Name Settings
Adjust the name of the application and how it appears in your browser tab.
Created: May 13, 2020