Viewing Timespans
Timespans overview
Clicking on the Timespans button in the Menu opens the Timespans View in the main application window.
The Timespans View is the SAS Enterprise Session Monitor historic data view. It provides a way to access all of the historic data that has been collected by SAS Enterprise Session Monitor. Using the wizard on the Timespans home tab, you can navigate directly to the time period that you are interested in.

The Timespans menu

-
A List of all Active sessions is a simple list of all processes active during the selected timespan. It allows individual processes to be filtered by name, and their timelines shown. It is often the fastest view to load.
-
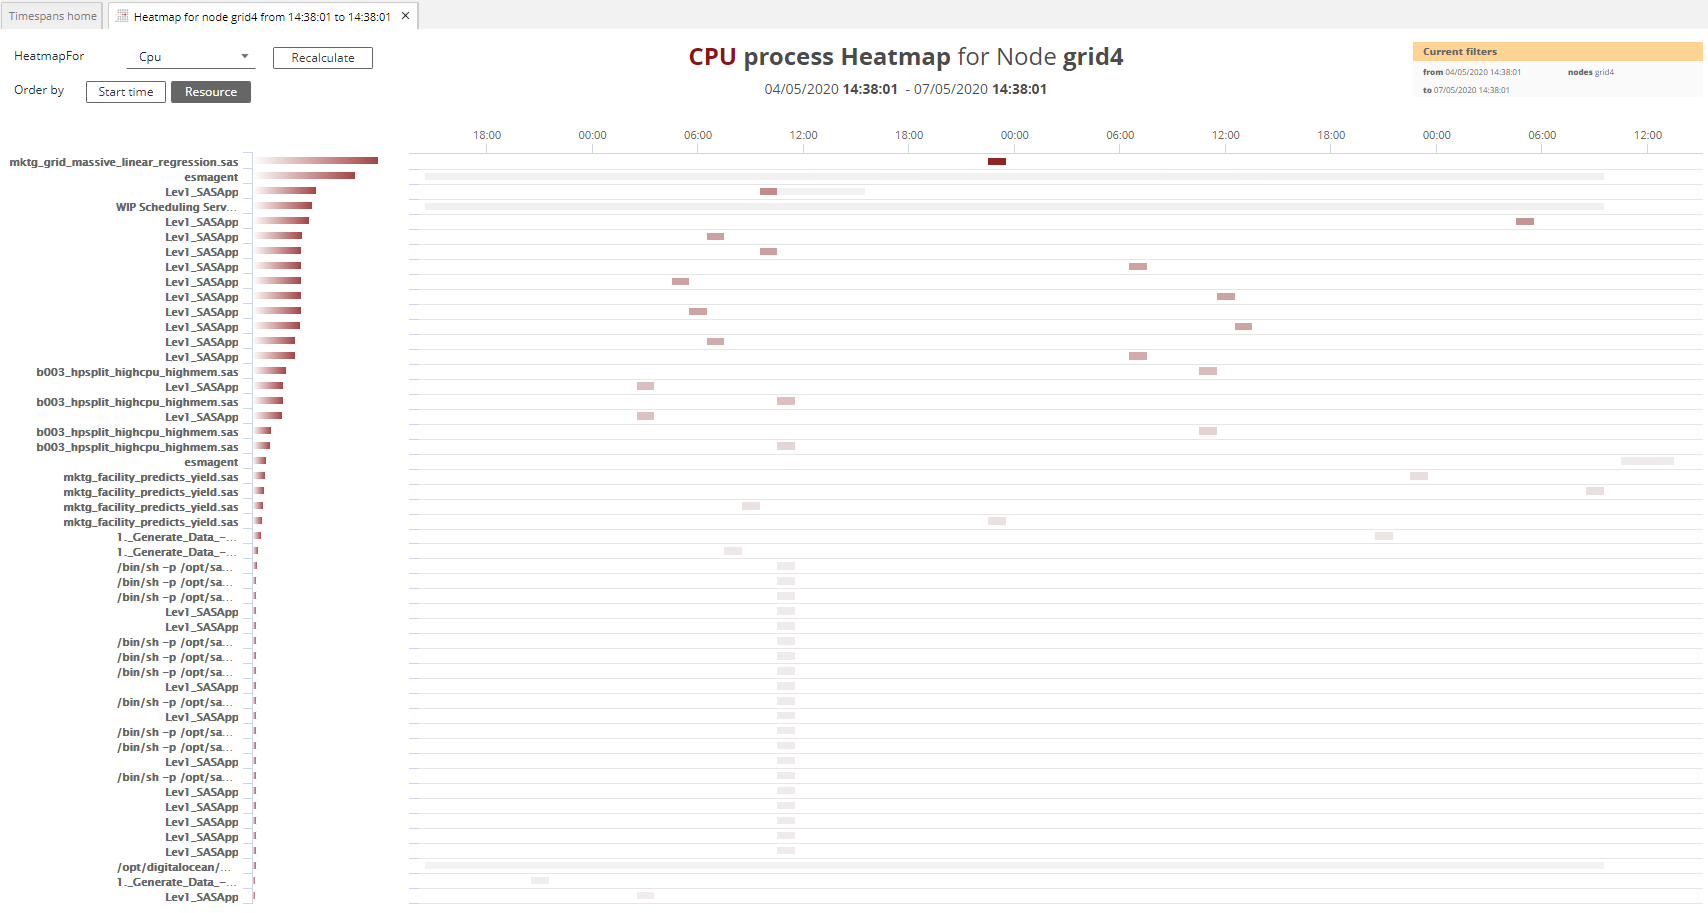
The Top 50 Heatmap will show the top 50 processes consuming a selected resource on the currently selected hostname. By default this shows the CPU utilization per process but other resource heatmaps are also available. Clicking on a process in a Top 50 heatmap will open the timeseries performance data for that process1.
-
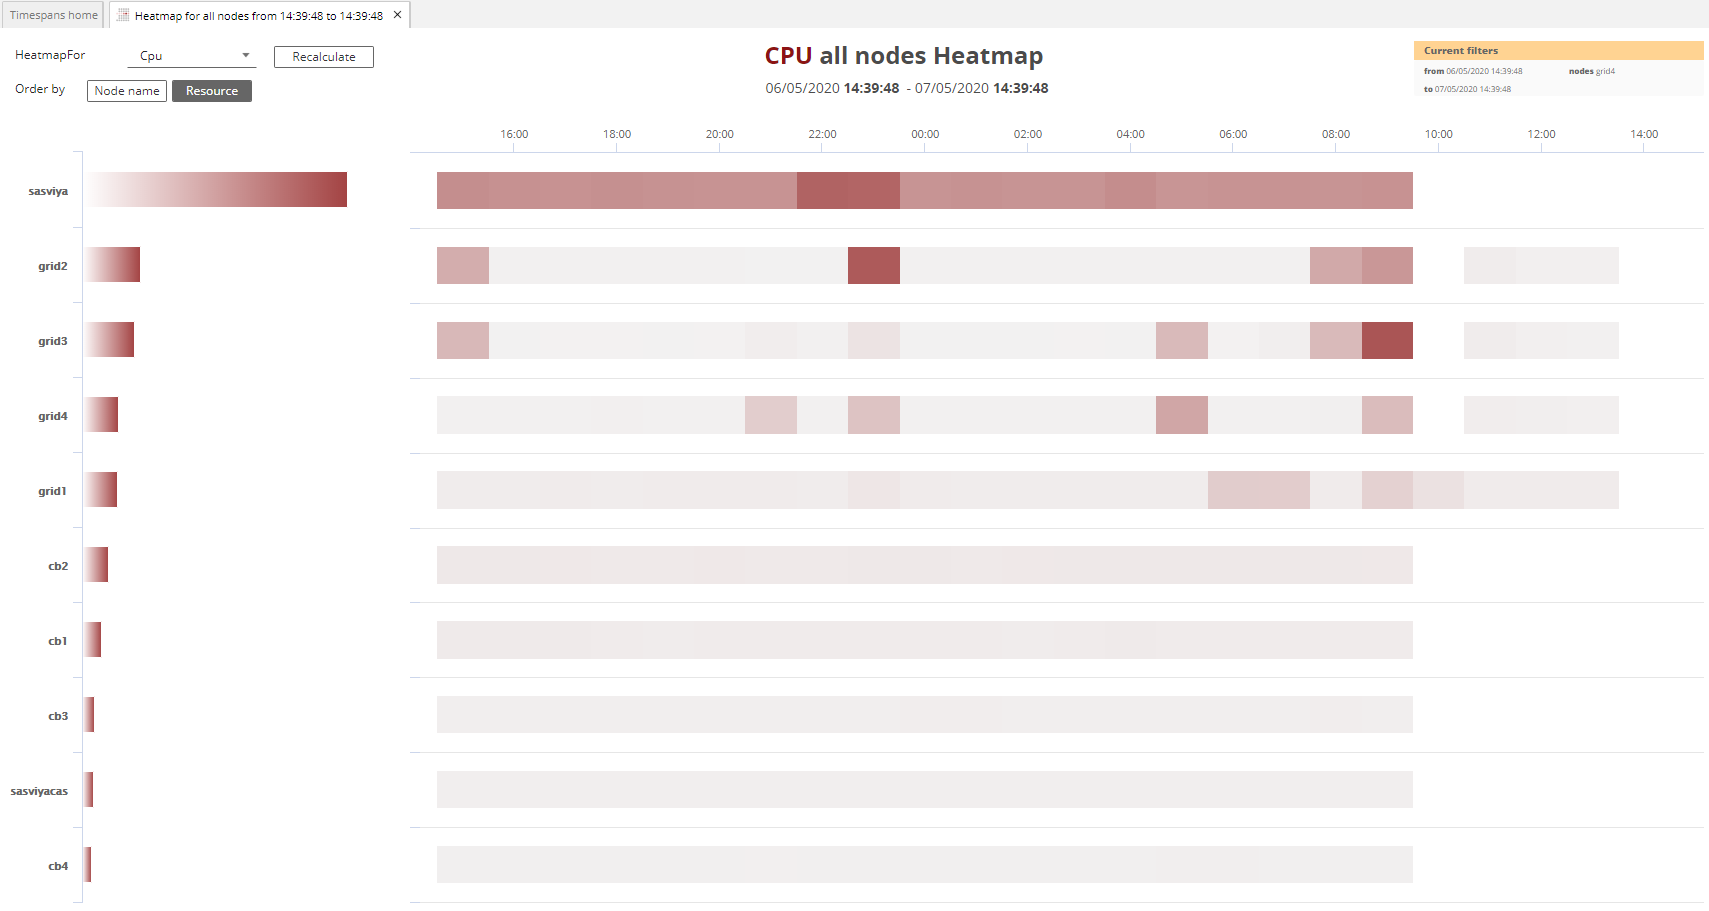
The Node Heatmap is a good starting point for a top-down investigation of issues. Selecting the node heatmap button will create a timespan showing the resources used across all nodes1.
-
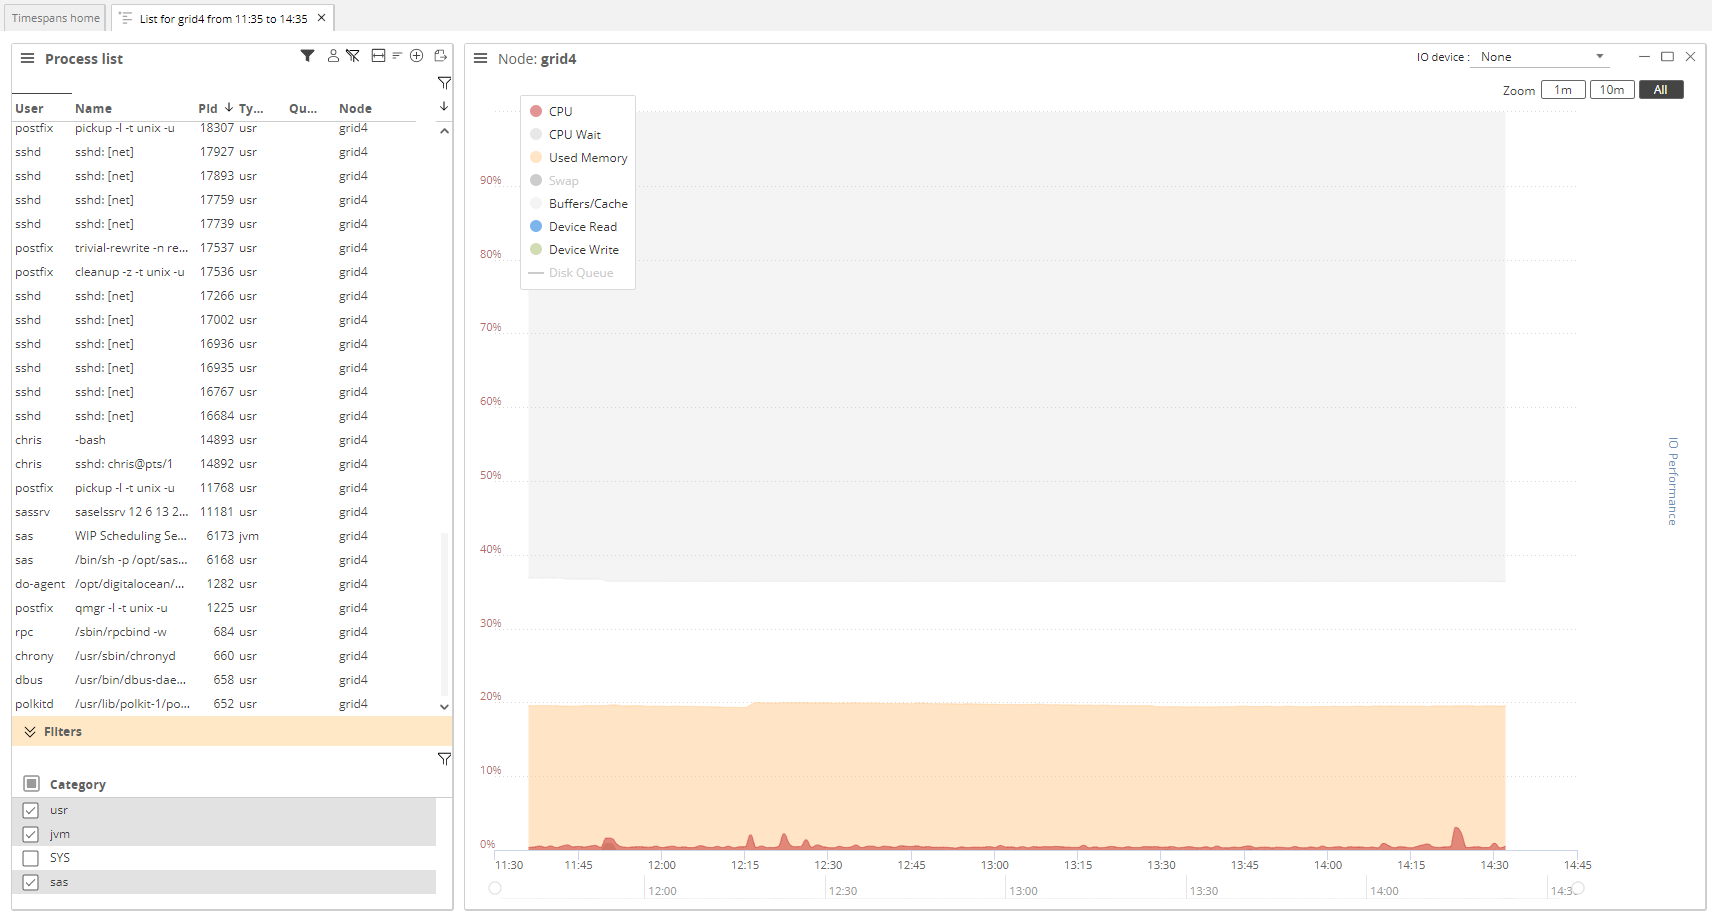
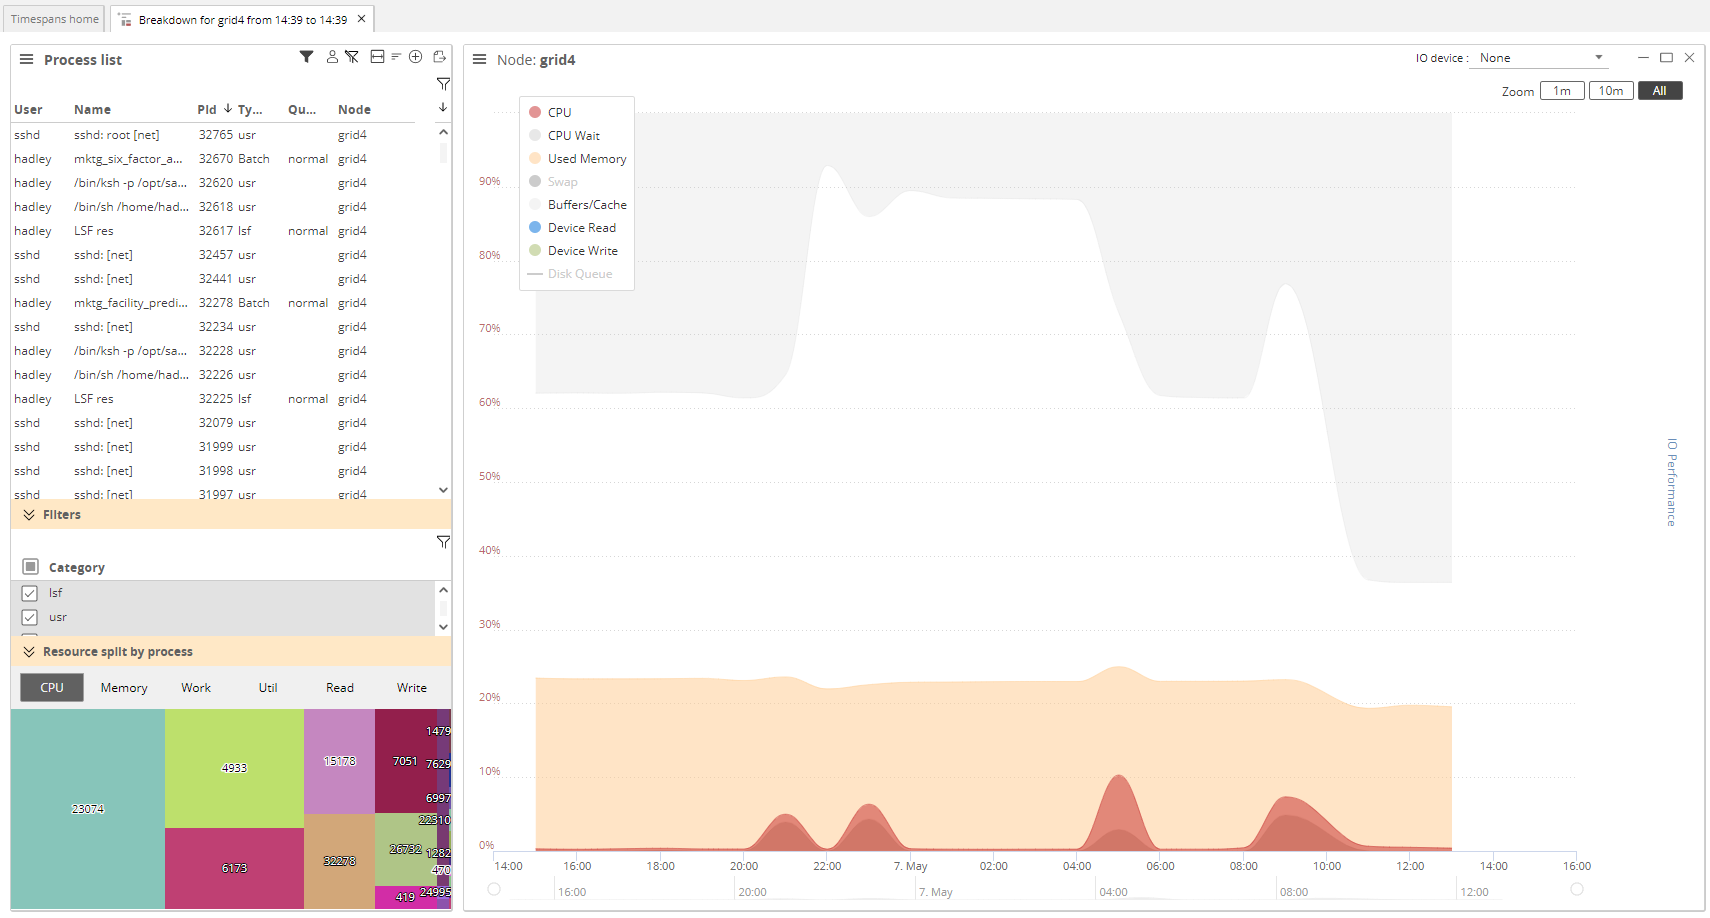
A Full Analysis of the selected timespan provides a comprehensive breakdown of resource usage, allowing you to select and compare multiple processes side by side.
-
A Job Search will search for all other invocations of a job if the selected process is a job itself. See Sessions and Jobs for more information about this view.
-
The Date Search provides a date picker to enable you to select a from and to date and time for which to create a custom length timespan. Selecting the node heatmap will generate a node heatmap for the selected time period.