Managing Global Settings
Clicking on the admin settings menu button will prompt you for your SAS Enterprise Session Monitor credentials. Once you have entered your SAS Enterprise Session Monitor username and password you will be presented with the Agent Settings screen.
Agent Settings
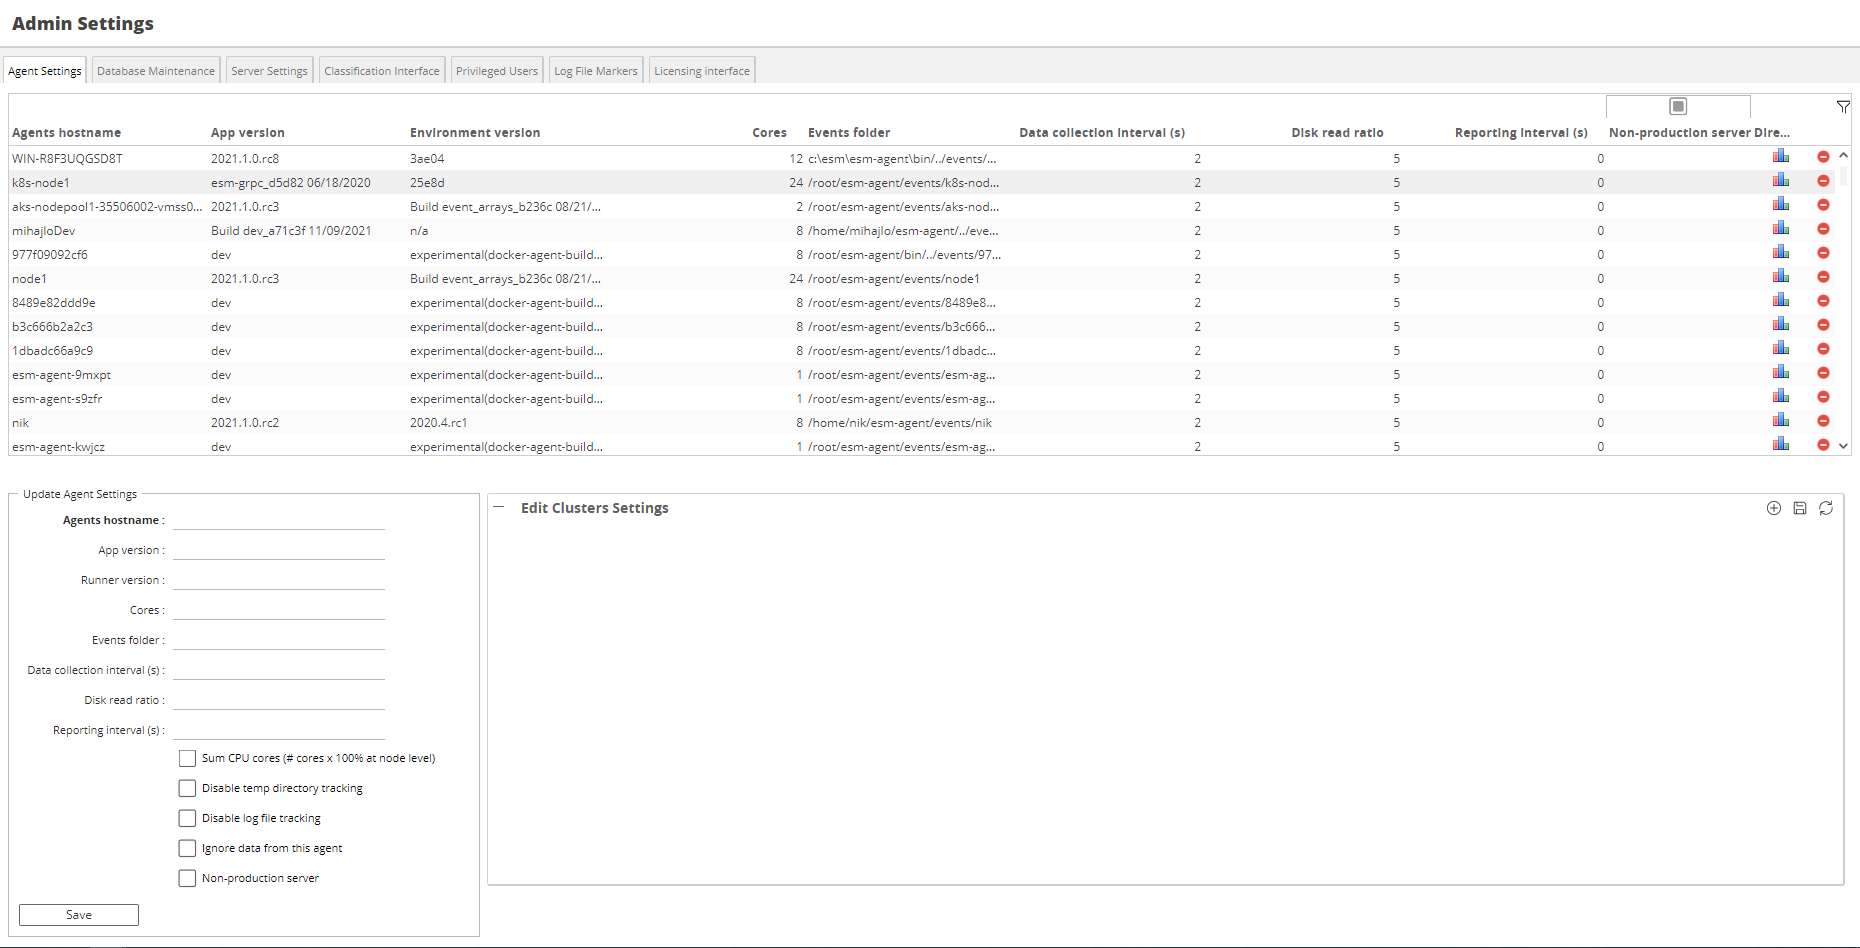
The Agent Settings screen displays a list of all of the agents that have been configured to talk to the SAS Enterprise Session Monitor server and provides an interface for updating agent configuration settings. Selecting an agent from the top table list of agents will populate the Update Agent Settings form automatically.
| Setting | Default Value | Editable | Description |
|---|---|---|---|
| Agent Hostname | N/A | No | Hostname of the agent for who's settings we are viewing/editing. |
| App Version | N/A | No | The version of the agent that this node is running. |
| Runner Version | N/A | No | The version of the runner that this agent is running. |
| Cores | N/A | No | The number of cores that the agent is reporting that the node has. |
| Events folder | $ESM_AGENT_HOME/events/$HOSTNAME |
Yes | This is the directory on the node that the Agent monitors for trigger (Event) files created by SAS sessions configured with SAS Enterprise Session Monitor. The initial value is set upon initial connection by the Agent, using the ESMEVENTS variable set in the Agent's esmconfig file. The location can be changed here for debugging purposes without restarting the Agent. When the ESMEVENTS variable is reconfigured in esmconfig, it must also be updated here. Alternatively, the node configuration can be removed entirely to allow the agent to set its default values. Note: For SAS Enterprise Session Monitor to function correctly, the Agents directory constructed by the SAS code located in the esmtags.sas file must, for each node, match the directory configured here. Changing this setting from the default is generally not recommended. |
| Data collecting interval | 2 | Yes | This setting changes the resolution of the data collected by the agent on that node. The default interval is 2 seconds, which is the lowest acceptable value. Increasing this number will lower the resolution of the data collected, therefore decreasing the amount of data stored in the database. This can also improve UI performance when looking at data over longer intervals, or when working with web browsers less capable of rendering a high number of data points. |
| Disk read ratio | 5 | Yes | This setting dictates how often the sizes of a Session's SASWork and SASUtil directories are measured. The default ratio of 5, means that the size of these directories is measured every fifth Data Collection Interval (see above). With a default Data Collection Interval of 2 seconds, and a ratio of 5, these directories are sized for each session every 10 seconds. With a data collection Interval of 5 seconds and a ratio of 12, the size of these directories will be checked once per minute. |
| Reporting interval | 0 | Yes | This setting changes how often the Agent sends a data packet to the Server. With the default setting of 0, the agent sends its data to the server after every Collection Interval. This interval can be increased to lower the frequency of network calls being made if desired. The default setting of 0 is recommended. |
| Sum CPU cores (set max load to cores x 100%) | False | Yes | This setting allows the overall CPU usage on the Server to be presented using the same scale as a Session graph. For example: With this setting disabled, on a node with 20 available threads, a 100% saturated CPU core will appear to consume 5% of the overall node CPU. The node CPU axis will be fixed at a maximum of 100%. With this setting enabled, on a node with 20 available threads, a 100% saturated CPU core will appear to be consuming 100% of the overall node CPU. Five 100% saturated CPU cores will appear as 500% CPU consumption on the node. The node graph will go to a maximum of 2,000%. This setting is generally not recommended. |
| Non-production server | False | Yes | When set, and when Enterprise Session Monitor is licensed by number of monitored cores, the number of Cores that the machine has are NOT deducted from the licensed core amount. |
Filesystem tracking
This is a compute intensive operation
If you do not select "Measure at the partition level only" and you select a top level folder that contains many sub folders (down as many levels as you have selected) this can cause the CPU utilization of your Agent to increase significantly. Use this functionality with caution.
Partition level tracking
When "Measure at the partition level only" only is selected, the data collected by the application is currently not visible within the user interface. This functionality will be available in a future release of the software.
It is often desirable to be able to track how full a particular partition is in your system, or how large a particular folder and which folder(s) or file(s) are taking all that space within a given folder structure. With SAS Enterprise Session Monitor's session tracking software, you're able to configure particular directories (and their associated partitions) to be measured.
![]()
Agent restart required
When settings are changed with regard to filesystem tracking, an agent restart is required for the changes to be picked up.
Database Maintenance
With SAS Enterprise Session Monitor 2022, significantly more control and visibility into the SAS Enterprise Session Monitor data and database is provided. Much more fine grained controls can be used to control the size of the database.
As SAS Enterprise Session Monitor collects data, it will try and estimate, given the current settings, how big the SAS Enterprise Session Monitor database will become. SAS Enterprise Session Monitor does this based on the number of sessions and the length of the sessions that it has collected data about.
Using the interactive chart, SAS Enterprise Session Monitor administrators can perform the following actions:
- Configure the estimated maximum size of the SAS Enterprise Session Monitor database
- View the amount of data (rows and size) of individual partitions for a particular table
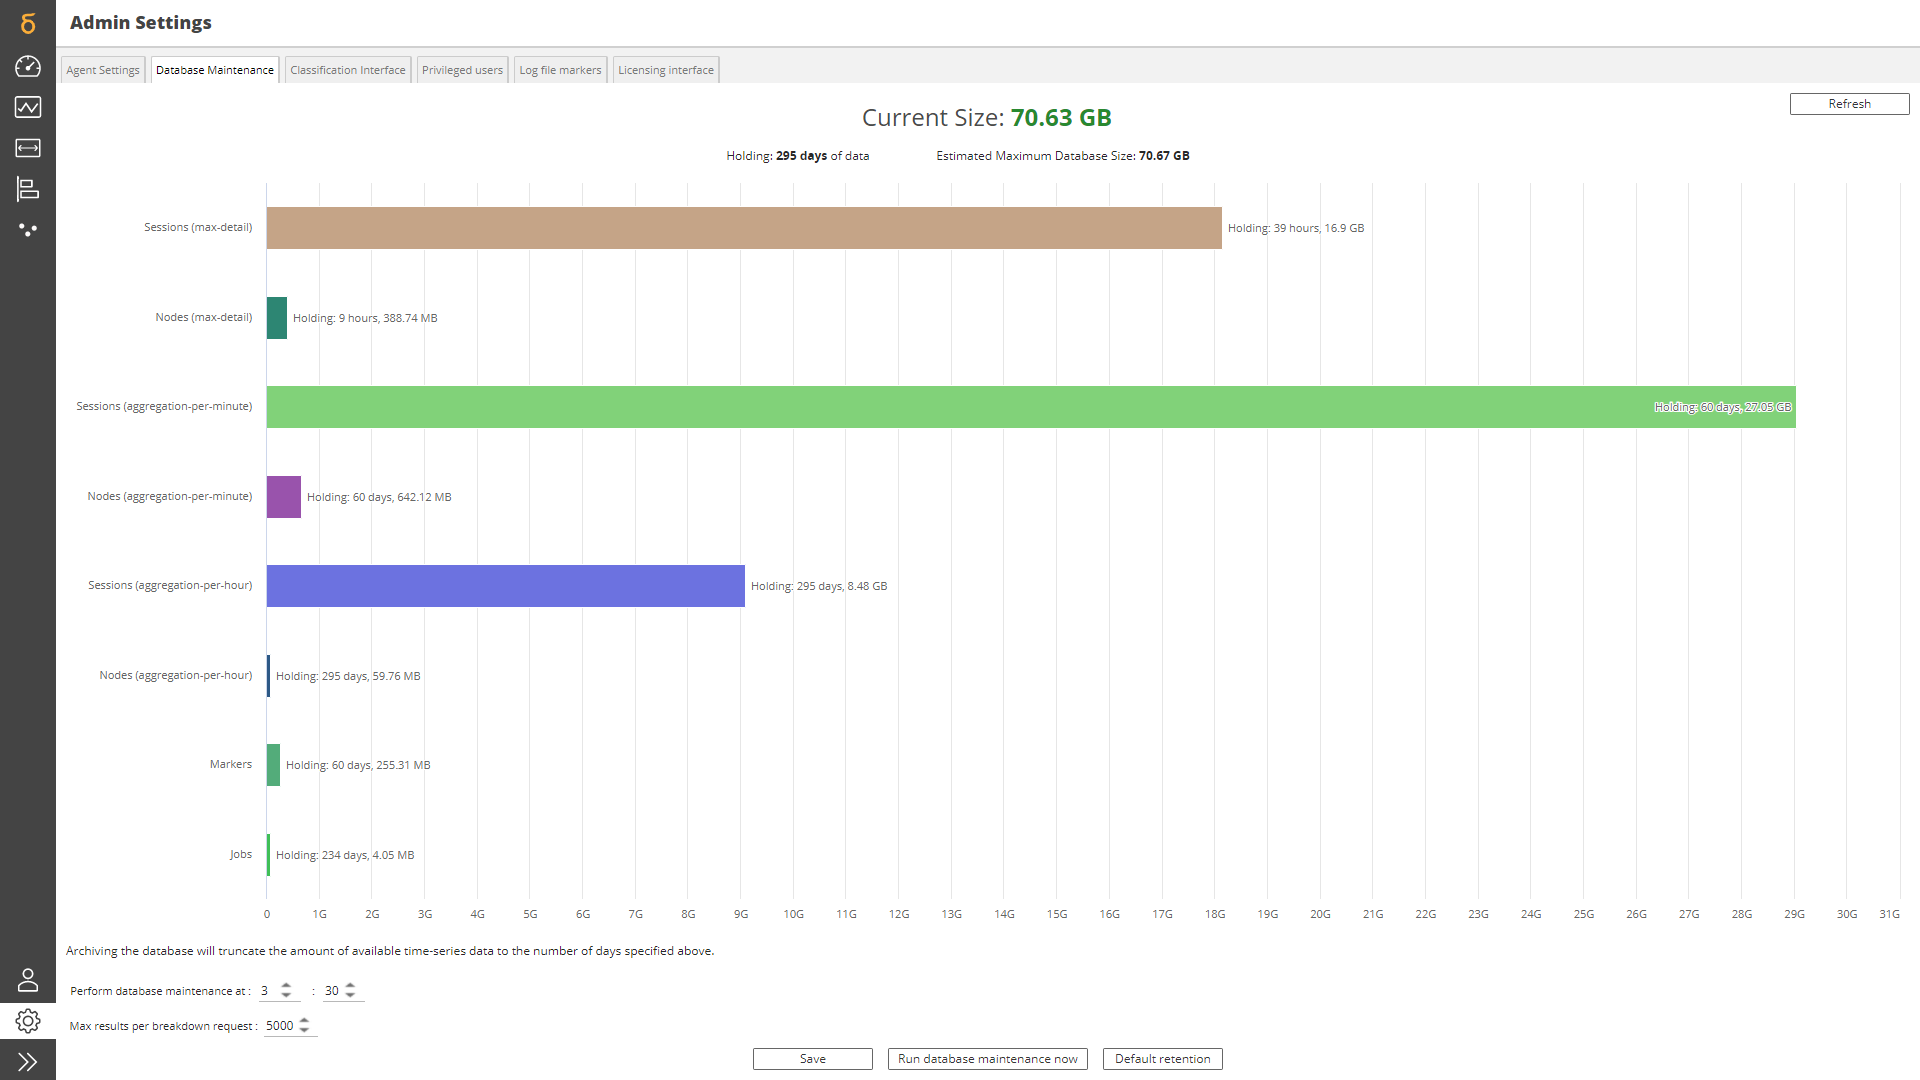
View and configure database size
The current size of the SAS Enterprise Session Monitor database, along with the number of days for which data is being held, and the estimated maximum database size, is displayed at the top of the Database Maintenance tab.
The number of days help metric is based on the oldest date for which session data exists in the database.
The estimated maximum database size is based on a forecast of the number and length of SAS Enterprise Session Monitor sessions and the number of days between the number of days that have been configured for the low-detail (hourly) aggregation and the number of days currently stored in the database.
The default settings for data retention are as follows:
- Max detail - 24 hours. This very high detail data captures data for each node and every session every 2 seconds (by default).
- Per-minute aggregation - 60 days. After the max detail time period expires, data is aggregated to a per minute level for each node and session.
- Per-hour aggregation - 365 days. After the per-minute aggregation time period expires, data is aggregated to a per hour level at both the node and session.
The estimated maximum database size can be tuned for your environment by dragging the bars of the top-level database maintenance chart left and right.
Changing the estimated size of one table (bar) on the chart will automatically adjust all of the other bars within the same aggregation group. For example, changing per-minute aggregation nodes table to be either a lot larger or smaller than its current size will have a significant impact on the estimated database size because of the size of the per-minute aggregation session table.
Viewing the partitions
Clicking on one of the bars on the top-level database chart will drill in to more details about the partitions of that table. It will show a bar per partition. Apart from the session table, all other tables are partitioned on a date column, daily. The Y-axis is therefore the partition date. The length of the bar is the size of the partition. Hovering over any of the bars will show the size of the partition and the number of rows contained within the partition.

Note
SAS Enterprise Session Monitor has a built-in configurable scheduler designed to ease the maintenance of the SAS Enterprise Session Monitor database. It allows the SAS Enterprise Session Monitor Administrator to adjust the time of day that the maintenance routines are triggered.
To avoid clashing with other batch routines that may be scheduled to start 'on the hour' or a similar rounded interval, the scheduler will delay its maintenance routine for a random time between 1 and 30 minutes before the database maintenance jobs are triggered.
Database Maintenance Time
Changing the Perform Database Maintenance time, and clicking the Save button, will update the time at which the daily maintenance of the database is performed. It is advised that this is set to a time of day when the number of concurrently active jobs will be at its minimum. The database maintenance routines manage both the partitioning of the data and the aggregation of the data.
Max results per breakdown request
This value is used to limit the number of results that are brought back from the database. Increasing this number can cause performance issues with the user interface when there are a very large number of data points. When this value is changed the "Save" button must be pressed.
Classification Interface
When the timeseries data for a session is archived by the database, a 'cost item' is created in place of the timeseries data. Cost items are held in the database and calculated on an hourly basis. Each cost item is marked with the name of the session or Job, the name of the user under which it executed, and the amount of resource that the session consumed during that hour.
The SAS Enterprise Session Monitor Classification Interface allows those cost items to be grouped into categories, so that overall system usage per category can be calculated for a given time period.
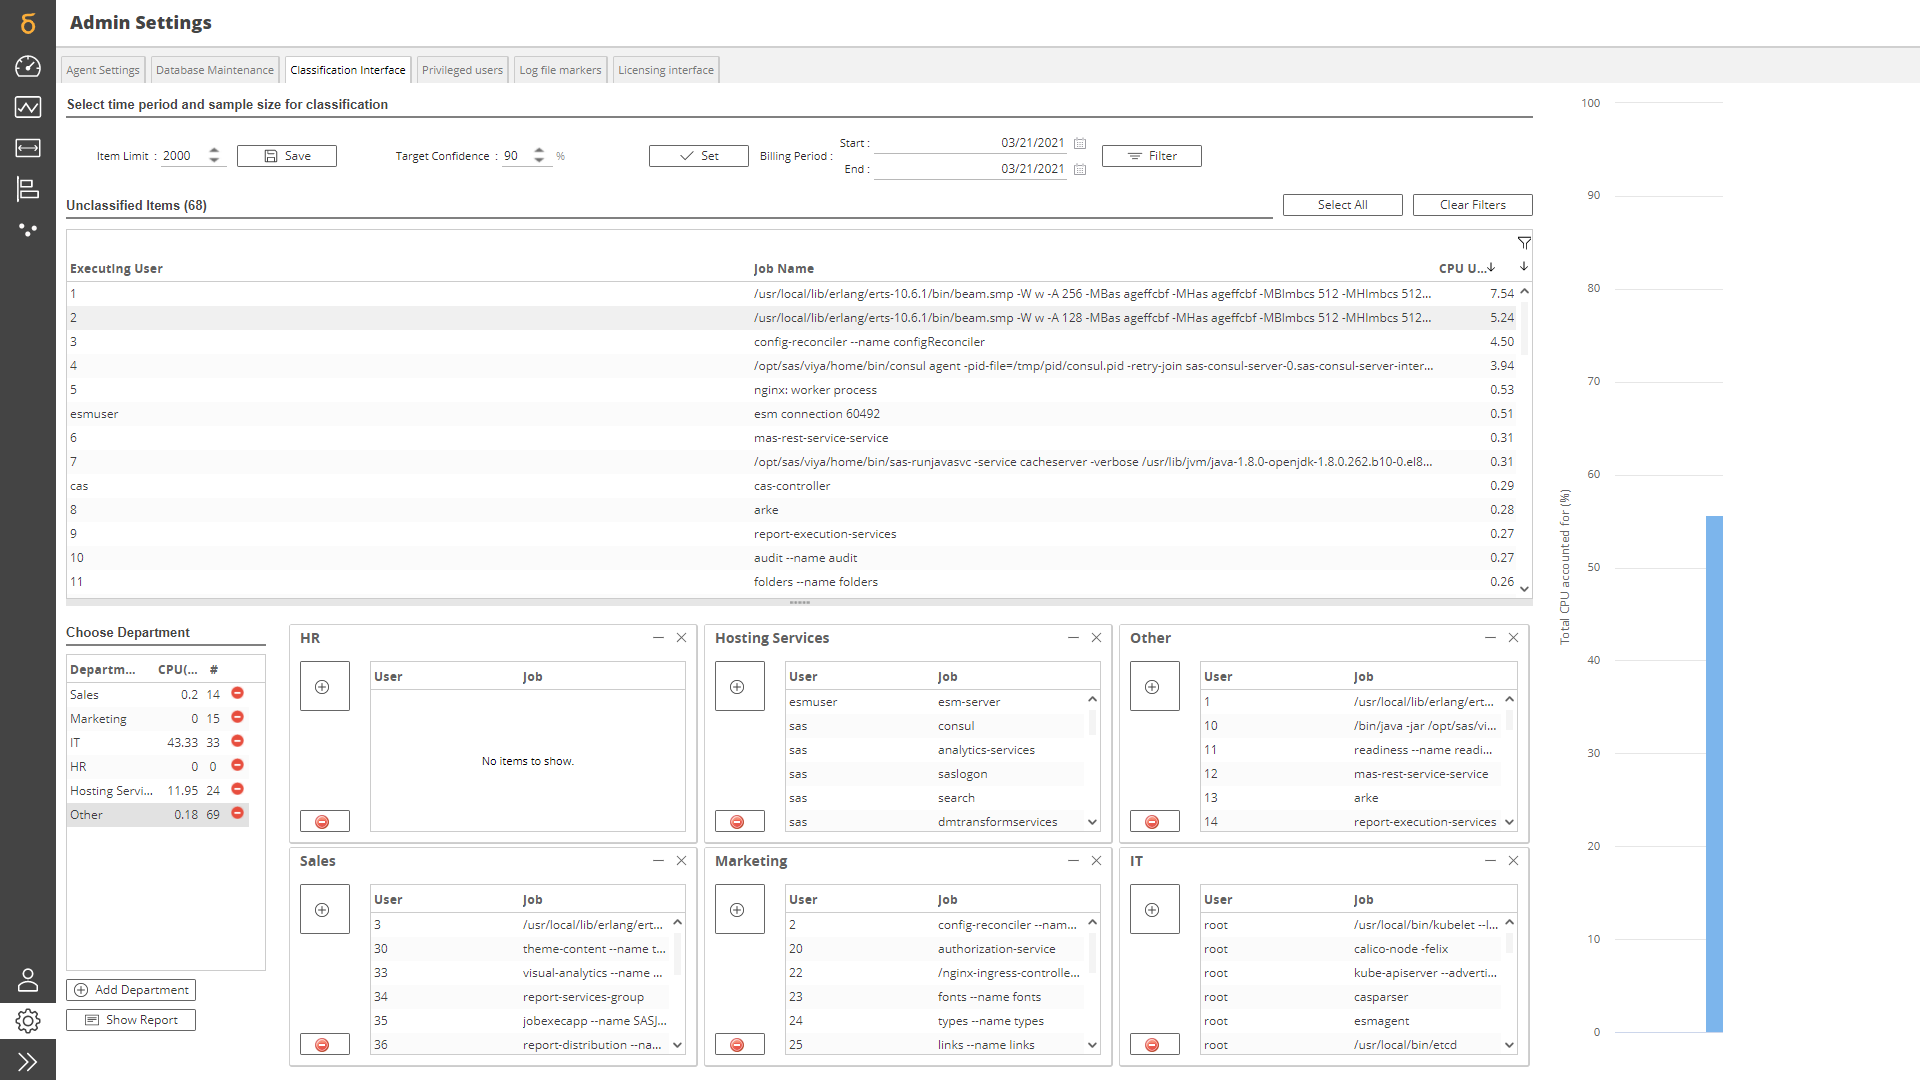
To access the SAS Enterprise Session Monitor Classification Interface, click the Open Classification Interface button at the bottom of the Admin Settings tab. You will be presented with the following settings:
Item Limit This number controls the maximum number of cost items that are shown in the Unclassified Items list. By default it is set to a conservative number of 2000. If, after setting the Target Confidence and Billing Period the Unclassified Items list still contains 2,000 unique items, this limit can be increased. The number of items shown are always sorted in descending order, therefore a limited list always contains the specified number of most significant cost items.
Target Confidence Like the Item Limit, this setting also controls the maximum number of cost items that are presented in the Unclassified Items list. Whereas the Item Limit setting is a Count of the total number of cost items presented for classification, the Target Confidence setting limits the cost items shown according to their significance.
For example, if the database contains 15 cost items, where the first 6 items make up 90% of the total Cost and the last 9 items make up the other 20%, then setting a Target confidence of 90% will mean that only those 6 items will be presented to the user for categorization, and the other 9 items will be considered as insignificant. If items 7 and 8 together add up to another 5% of cost, then setting the Target confidence to 95% will include the first 8 items in the list of items to be classified, ignoring the remaining 8 that make up the smallest 5% of cost.
Billing Period This setting allows the Cost Items to be filtered according to the period during which they occurred. Any cost items that sit outside the specified date range are ignored.
Allocating Cost SAS Enterprise Session Monitor groups the cost items into unique job name / user combinations and calculates their share of the overall CPU consumed, taking into account the filter settings above. In order for the desired Target Confidence to be achieved, each of the cost items needs to be classified into Department.
Departments are created by clicking the Add Department button, which will prompt the user for a Department Name to be added to the list. When all departments have been added, their cost buckets can be opened by clicking each department in the Choose Department list.
From this point, each of the cost items in the Unclassified Items list must be allocated into a Department. This can be done by dragging and dropping each item in the list into a Departmental Bucket, or by selecting multiple items in the Unclassified Items list and clicking the (+) button on the department's cost bucket item. In addition, the Unclassified Items list can be filtered on Job Name or Executing User patterns, and clicking Select All and then (+) will assign all items appearing in a filtered list to the selected Departmental bucket.
The Total CPU Accounted For is designed to act as an indicator of progress. Clicking the Show Report button at any time will show a report detailing the breakdown of costs per department, along with a list of the top Users and Processes responsible for those costs. Clicking the Print Report button in this screen will present the report in a format which can be printed and reviewed by the party responsible for the system usage in each Department.
The username/jobname lookup lists created during the classification process persist in SAS Enterprise Session Monitor across billing periods. While the first classification exercise may be arduous, subsequent instances will only require the classification of cost items which have newly entered the list of significant cost items, as defined by the Item Limit and Target Confidence settings.
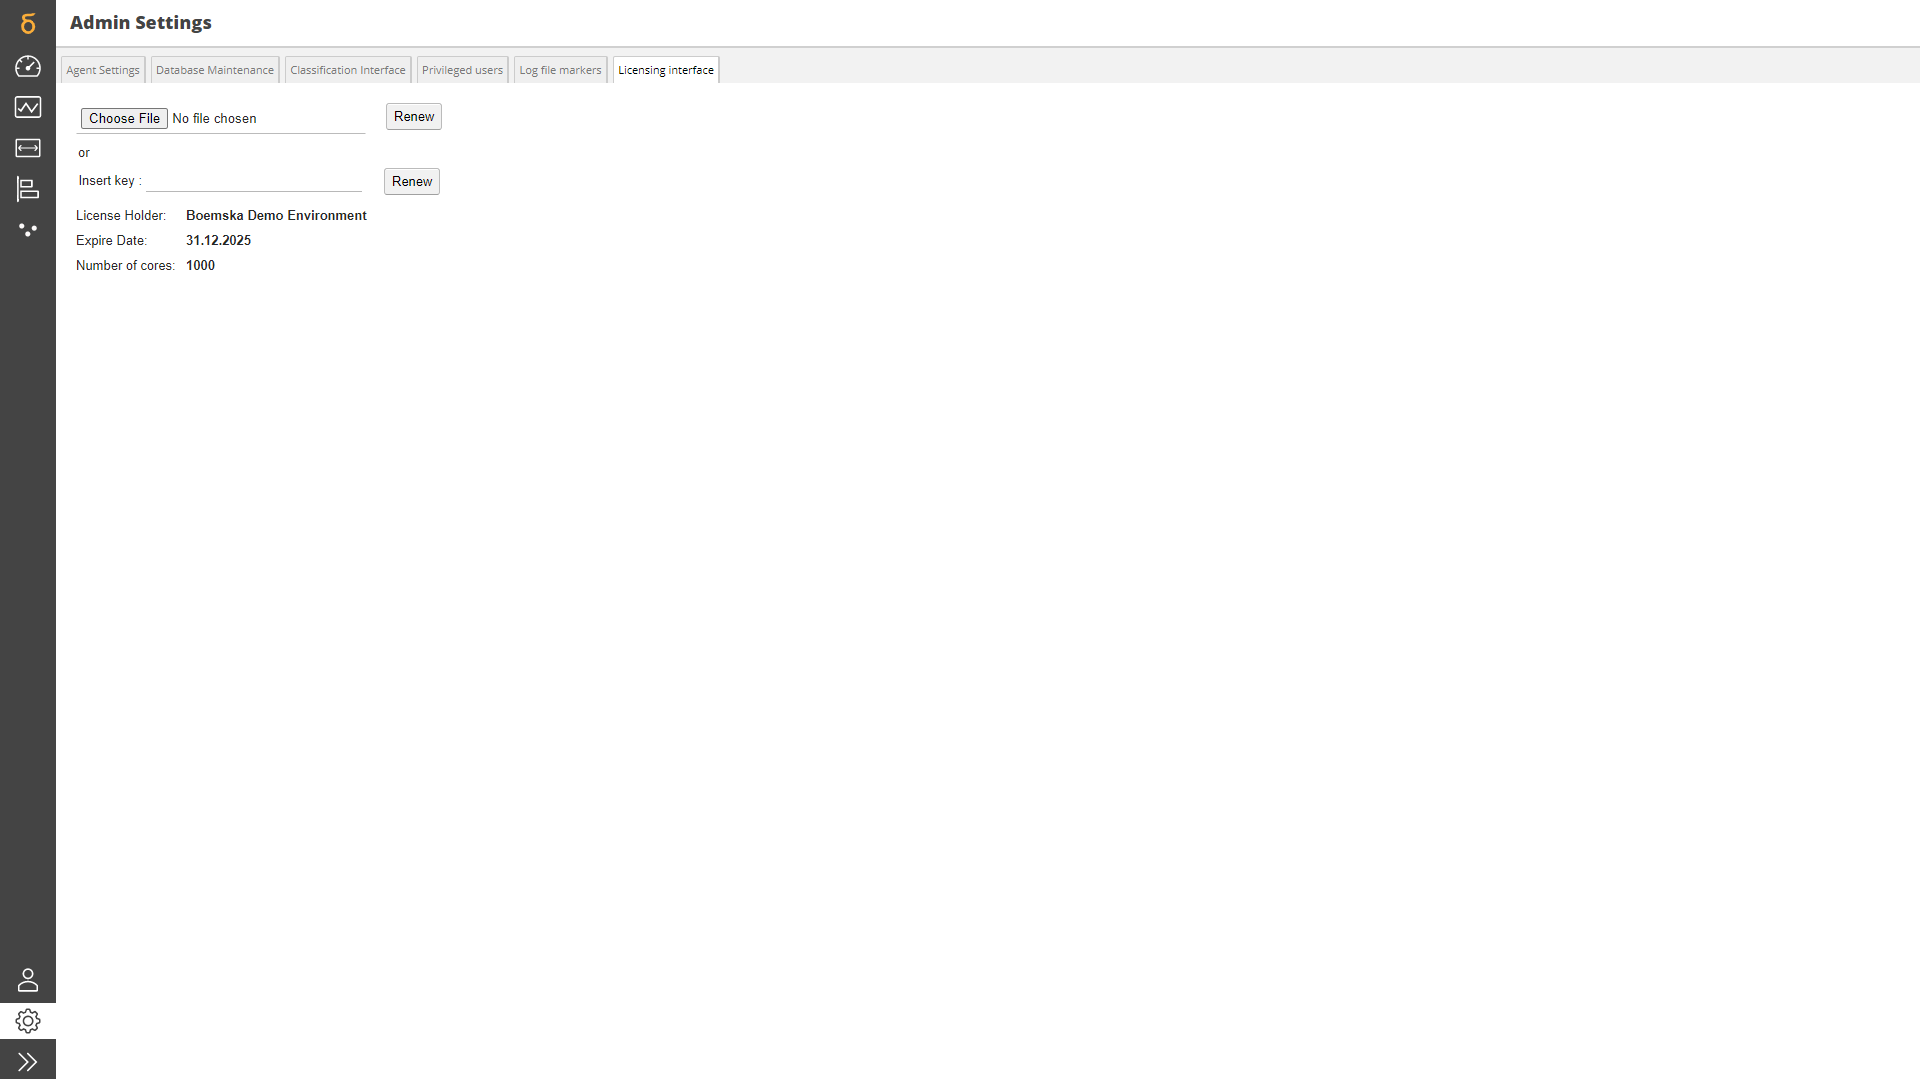
License Interface
The license interface allows a SAS Enterprise Session Monitor administrator to view the details of the current license and update the SAS Enterprise Session Monitor license through the user interface.
The license can be updated one of two ways:
- Uploading a valid SAS Enterprise Session Monitor license key into the user interface and clicking "Renew"
- Pasting a valid SAS Enterprise Session Monitor license key into the user interface and clicking "Renew"
Once you have updated the SAS Enterprise Session Monitor license using either of the above methods, the new license information will be displayed on the screen. For more details on how to update your Enterprise Session Monitor license please review the update license admin task documentation in the Enterprise Session Monitor administration guide.
Core Based Licensing
When you license SAS Enterprise Session Monitor by "monitored cores", the number of cores in the license file represents either:
- On a physical machine, the number of physical cores that the system has
- On a virtual machine, the number of vCPUs that are assigned to the machine
User Based Licensing
When you license SAS Enterprise Session Monitor by "authorized user", the number of users in the license file represents the number of active users you are eligible to have within the Enterprise Session Monitor privileged user's list.
Privileged Users
Users in SAS Enterprise Session Monitor can be separated into the following roles:
- General Users
- Privileged Users
- The Administrator
When SAS Enterprise Session Monitor is license by Cores General Users do not require any authentication within SAS Enterprise Session Monitor. Privileged Users and the Administrator are prompted for credentials when they attempt to use the advanced features of the application. The roles are hierarchical: Privileged Users and Administrators are able to access all of the functionality available to General Users, and the Administrator is able to access all of the functionality available to Privileged Users.
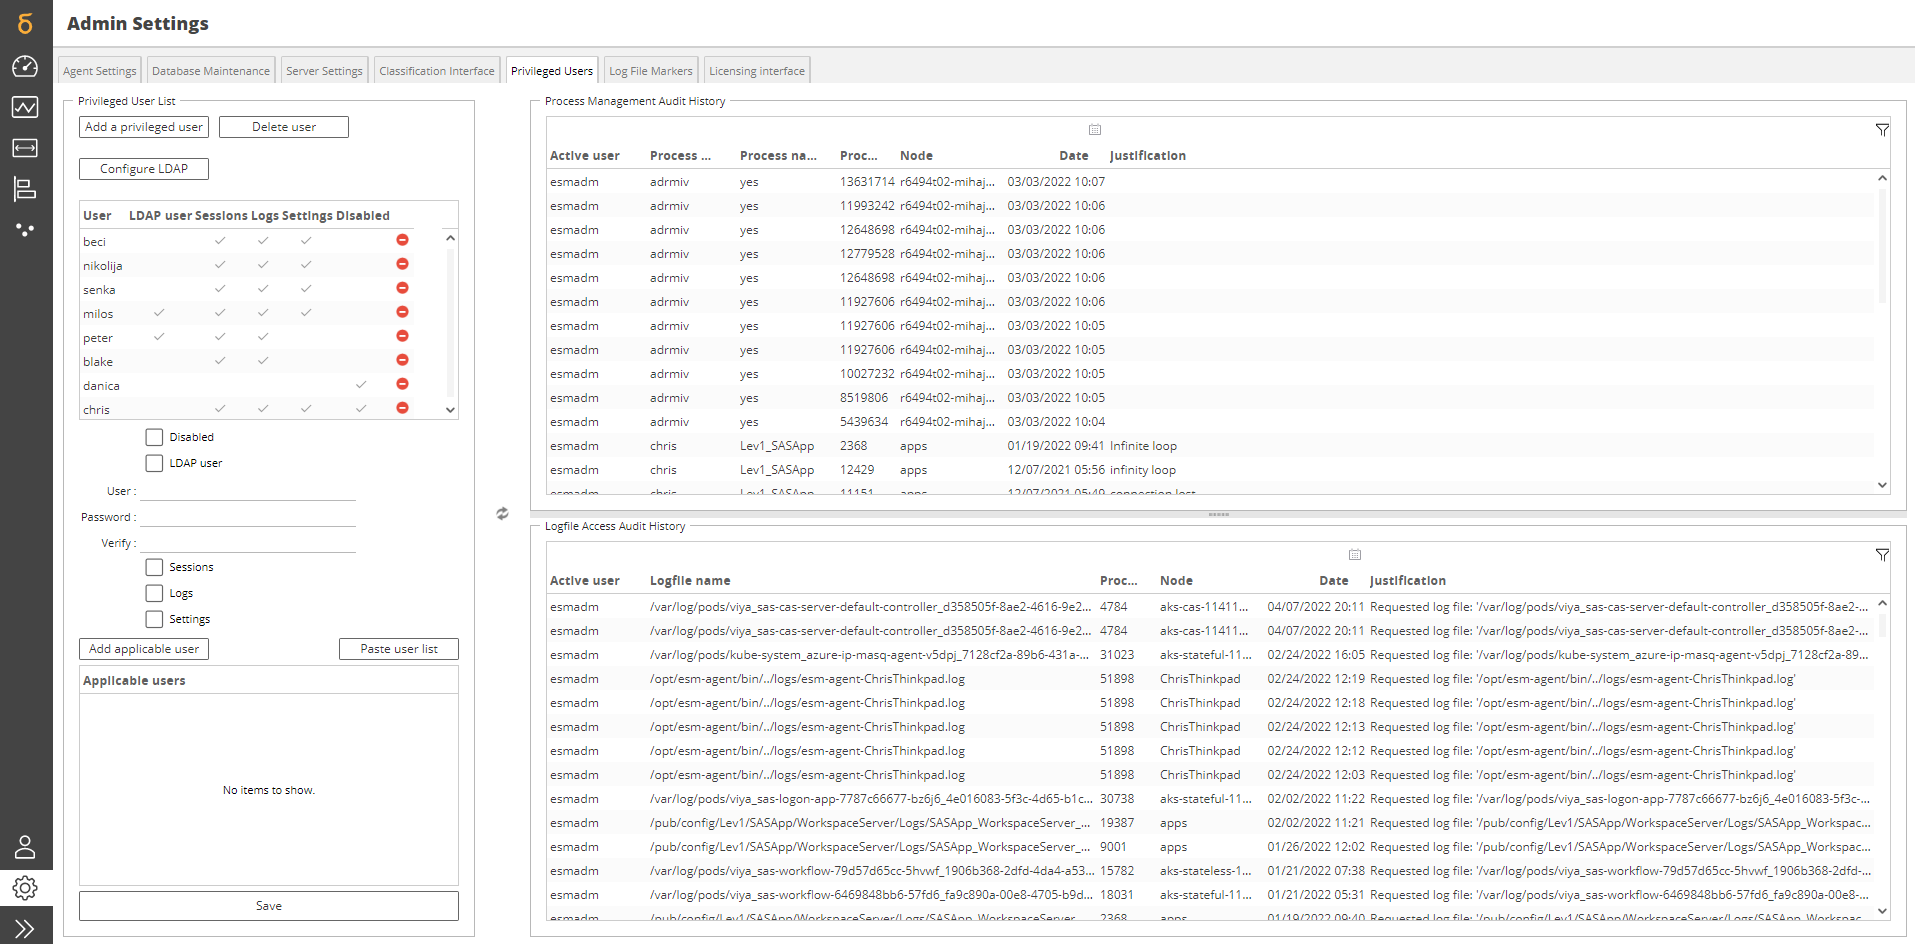
To add a user to the list of Privileged Users, click the 'Add Privileged User' button. This will change the focus to the username field further down the screen where you'll be prompted to create a password for the user and assign the permissions for the user:
Sessions
If permitted by the Operating System and the SAS Enterprise Session Monitor configuration, the SAS Enterprise Session Monitor agent can be used to terminate unresponsive, orphaned or unwanted SAS sessions. Once a session is identified, it can be terminated using a menu accessed by right-clicking on the session in the List Portlet in the Live View.
The menu presents the following options:
- Terminate Process
This sends the process the equivalent of a SIGTERM signal for UNIX platforms, and a taskkill command on Windows platforms. Once the process is terminated, the Agent ensures that the temporary directories related to that process have been removed.
- Force Terminate Process
This sends the process the equivalent of a SIGKILL signal for UNIX platforms, and a taskkill /f command on Windows platforms. Once the process is terminated, the Agent ensures that the temporary directories related to that process have been removed.
- Force Terminate Process leaving temporary directories intact
This sends the process the equivalent of a SIGKILL signal for UNIX platforms, and a taskkill /f command on Windows platforms. Once the process is terminated, the Agent leaves any temporary directories that may be related to that process intact.
Note
If a process is known by SAS Enterprise Session Monitor to be a System (SYS) process, or if it is not an instance of the sas binary executing, the process can not be acted upon. This limitation is imposed as a security precaution1.
Important
All actions performed using the Session Management menu are audited by SAS Enterprise Session Monitor. A history of all Session Management actions can be seen in the Privileged Users section of the SAS Enterprise Session Monitor Admin Settings screen.
Logs
When SAS Enterprise Session Monitor is passed a 'log file' option for a Session, such as in the case of a Batch Job, SAS Enterprise Session Monitor will continually monitor that log file for occurrences of WARNING and ERROR messages. When either a Warning or Error message occurs, it is plotted against the timeline of that session in real time as a flag. Hovering over the flag using the mouse displays the warning or error text. Clicking on the flag retrieves the log file in question, opens it in a new tab and navigates to the line where the error occurred.
If this behavior is configured as restricted to Privileged Users, suitable credentials must be entered prior to the logfile being retrieved.
Disabling a privileged user
When Enterprise Session Monitor is licensed by number of authorized users only active users defined in the privileged users table can access the application. The application will prevent an Enterprise Session Monitor Administrator from adding more users to the privileged users table where the number of active users will be greater than the number of authorized users as specified in the license.
To allow you to list more users, it is possible to mark a privileged user as Disabled. By disabling a user they will remain in the privileged users table but the username specified will not be able to access the application even if they authenticate correctly. The users will receive the following message:

Changing the SAS Enterprise Session Monitor Administrator Password
The overriding password for the SAS Enterprise Session Monitor Administrator is stored in a main password file and secured using filesystem-level security.
To change the SAS Enterprise Session Monitor Administrator username and password, log on to the machine where the SAS Enterprise Session Monitor Server is running as a suitably privileged user. Then, edit the admin.txt plaintext file, located in
[esm home]/esm-core/glassfish/domains/domain1/config
The format of admin.txt should as follows:
esmadminusername
esmadminpassword
Note: When saving the password file, ensure that the correct permissions continue to be applied to it. It can only be read by the SAS Enterprise Session Monitor system account, and written by a designated user / administrator of the underlying operating system.
Log file markers
SAS Enterprise Session Monitor can be configured to automatically scan log files that it is aware of to detect events that users might want to know about such as ERROR and WARN events in SAS. These log file markers are used to annotate the process portlet charts.
Log file marker rules can be defined in two ways, through the SAS Enterprise Session Monitor user interface or via a JSON import mechanism2.
UI Adding and Editing
Clicking Add or Edit while highlighting an existing log file marker pattern will bring up the Add/Edit regex dialog box. From this screen you can create or modify SAS Enterprise Session Monitor log file marker patterns.
Regex parameters
The regex parameters are used to define the rules which are applied when the log file parser is run.
-
Filename pattern - When log files are found to be associated with a session the filename rule is applied first. This ensures that only those rules which match the file name pattern are applied when reading the contents of the file. This is done for performance reasons.
The file name in this context includes the full path to the file. If you wish to just distinguish between files of different names you can use the
.*regex to start the filename, for example,.*WorkspaceServer_\d{4}-\d{2}-\d{2}_.*[0-9]+.log. If you wish the rule that you are creating or editing to apply to all files, leave this field blank -
Hostname pattern - After the file name pattern is run, the hostname of the server from which the session is associated is checked. The hostname pattern accepts a valid regex pattern or, if you wish for the rule to applied to all host, can be left blank.
-
Log line filter - For each line of the applicable log files that are read by the agent this is the rule that gets applied. Parts or all of the line can be used in either the tag text or the tool tip text by capturing the relevant data using named regular expression capture groups. For example, capturing the whole line in a capture group called
linecould be done with(?<line>.*). The variable${line}would then be available for both the tag text and tooltip text properties. -
Tag text - The tag text is the value that is visible in the chart annotation (see below). Valid values can be from a named capture group from the log line filter accessed using the notation
${cgname}wherecgnameis the name of the capture group, hard coded text, or blank.We recommend keeping these values has short as possible so as not to clutter the charts. You'll notice that the default log marker patterns shipped with SAS Enterprise Session Monitor are a single character like
EorW. -
Tooltip text - The Tooltip text is the text that you see when you hover your mouse over the chart annotation. In most cases this will be the value from a named capture group from the log line filter. For example, if you had a capture group called
msgin your log line filter, the value of the tooltip text might be:${msg}. -
Marker color - The marker color defines the background color of the chart annotations. A valid color-hex code is required3.
Sample Input
This is where you can test the rules that you have configured with sample data.
- Sample file name - This is an example of a full file path, including the file name, that you wish to test the filename pattern.
- Sample hostname - This is an example of a hostname to test the hostname pattern filter. The hostnames that are passed to this filter will match the hostnames that you see in the live view and that were configured during the agent installation process. For a SAS system, this should match the value of the
&syshostnamemacro variable. - Sample log data - This is the data that we are going to test the log line rule, tooltip text rule and the tag text rule. This area should be populated with a sample for the type of log file that you wish to test. It should contain one or more lines that you wish to match
Sample Output
Having defined a rule (at a minimum the log line filter, tag text, tooltip text, and marker color) and provided some sample data, the bottom half of the add/edit regex dialog provides an example of what a chart will look like based on the sample input and the rules that you have defined.
JSON Import / Export
The log marker settings import export functionality is available starting in SAS Enterprise Session Monitor 2020.4. It provides a simple way of importing and exporting large and complex log marker rule sets between SAS Enterprise Session Monitor installations.
Export
Clicking on the Export button will automatically download an export.json file containing all of the rules that you have in configured and saved within your environment. The file is downloaded to your browser's default downloads directory.
Import
Clicking on the Import button will bring up an Open File dialog prompting you to select a file to upload.
File format
The SAS Enterprise Session Monitor log marker upload parser accepts an array of JSON objects. Each object in the array must contain the following properties (all properties are required by can be set to null):
Special regex characters, for example, \s, used to denote a space will need to be escaped within the JSON string. Special characters are escaped by using backslash: \\s.
- fileName - This is the filename pattern. Specify
nullfor the rule to apply to all filenames - hostnameRegex - This is the hostname pattern. Specify
nullfor the rule to apply to all hostnames - searchRegex - This is the log line filter. A valid JSON escaped regular expression string must be provided for this field.
- fixedOutputTitle - This is the tag text field. A string value must be provided for this field.
- outputRegex - This is the tooltip text field. A string value must be provided for this field. This field can contain variables in the form of
${name}wherenameis a named capture group in thesearchRegexstring. - color - This is the color value for the rule. Must be a string value, starting with a
#and be a valid hexadecimal color value.
An example of a valid file might be:
[
    {
        "fileName":".*ObjectSpawner_\\d{4}-\\d{2}-\\d{2}_.*[0-9]+.log",
        "hostnameRegex":null,
        "outputRegex":"${msg}",
        "fixedOutputTitle":"E",
        "color":"#FF9999",
        "searchRegex":"^(?<timestamp>\\d{4}-\\d{2}-\\d{2}T\\d{2}:\\d{2}:\\d{2},\\d{3})\\sERROR\\s[^:]+:\\w+\\s-\\s(?<msg>.*)"
    },
    {
        "fileName":".*ObjectSpawner_\\d{4}-\\d{2}-\\d{2}_.*[0-9]+.log",
        "hostnameRegex":null,
        "outputRegex":"${msg}",
        "fixedOutputTitle":"W",
        "color":"#F5ED0F",
        "searchRegex":"^(?<timestamp>\\d{4}-\\d{2}-\\d{2}T\\d{2}:\\d{2}:\\d{2},\\d{3})\\sERROR\\s[^:]+:\\w+\\s-\\s(?<msg>.*)"
    }
]
-
For more information about administering the SAS Enterprise Session Monitor global settings or for more advanced SAS Enterprise Session Monitor Administration options please see the SAS Enterprise Session Monitor Administration Guide ↩
-
The log marker settings import functionality is available in SAS Enterprise Session Monitor 2020.4 and later. ↩
-
A great site for finding colors that you like can be found at https://www.color-hex.com/. For your assistance and reference, the SAS Enterprise Session Monitor default ERROR color is
#FF9999and WARN is#F5ED0F. ↩