Viewing Live Data
The Live View overview
Clicking on the Live View button in the Menu opens the Live View in the main application window.
The Live View is the SAS Enterprise Session Monitor real-time view. It lists all sessions currently executing on every node of the environment being monitored. Single clicking on one of the listed sessions loads the last five minutes of performance data for that session. This data is then continually updated, at a default interval of every two seconds.

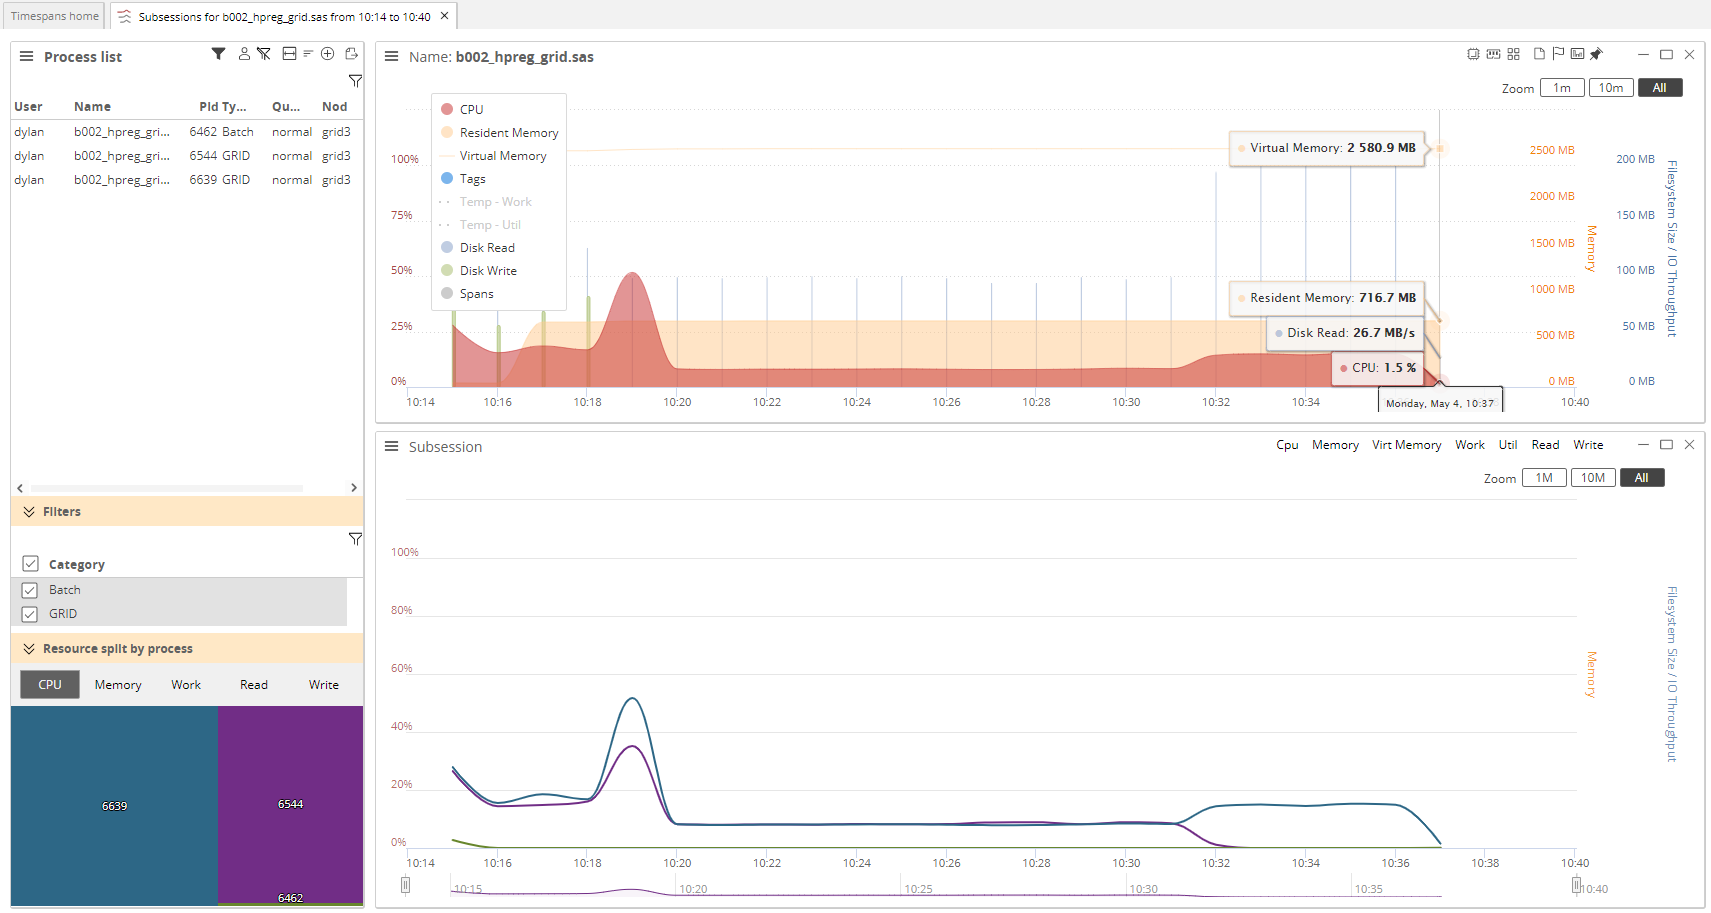
The Live View consists of the Process List portlet on the left, a Session portlet on the top right, and a Node portlet on the bottom right. The List portlet is used to navigate the list of available sessions, while the Session and Node portlets display the data for the session selected.
The Session Portlet and Node Portlet in SAS Enterprise Session Monitor are permanently synchronised. This means that both portlets will always display data for the same time window, including when one of the portlets is zoomed. The Node portlet will also always display data for the node that the selected Session executed on. In cases where multiple session portlets are showing (i.e. as part of a Timespan) the Node portlet will always correspond to the most recently opened Session portlet.
Process List Portlet
The Hamburger menu in the top left hand corner of the Process List portlet can be used to access the functionality for the Process List Portlet

Apply Team Filter
If you have defined a team within the User Settings section of the application, you can apply the team filter by selecting the Apply team filter menu option.
Process Grouping
When the Configure Grouping option is selected the Process Grouping menu will be opened. Processes can be grouped by all of the columns that are available in the Process List portlet. Process grouping selections are local to the browser.

- Add Level - This button will add a new row to the dialog and open a drop down menu for the column.
- Delete Level - This button will remove the selected row from the grouping
- Copy Level - This button duplicates the selected row and add it to the bottom of the hierarchy.
- Up Arrow - This button moves the selected row up the grouping hierarchy
- Down Arrow - This button moves the selected row down the grouping hierarchy
- Apply - This button will apply the configured grouping to the processes that are visible in the Process List portlet.
- Cancel - This button will cancel the dialog and changes made will not be applied.
If the grouping in the above screenshot was applied, the user may see something like the following:

Process Sorting
When the Configure sorting option is selected the Process Sorting menu will be opened. Processes can be sorted by all of the columns that are available in the Process List portlet. Process sorting selections are local to the browser.

- Add Level - This button will add a new row to the dialog and open a drop down menu for the column.
- Delete Level - This button will remove the selected row from the grouping
- Copy Level - This button duplicates the selected row and add it to the bottom of the hierarchy.
- Up Arrow - This button moves the selected row up the grouping hierarchy
- Down Arrow - This button moves the selected row down the grouping hierarchy
- Apply - This button will apply the configured grouping to the processes that are visible in the Process List portlet.
- Cancel - This button will cancel the dialog and changes made will not be applied.
If the grouping in the above screenshot was applied, the user may see something like the following:

Process Filtering
Above the row of column headings is a blank row. This is a row of input fields that can be used to filter the column for which it is above. Typing into the box will, by default, perform a "contains" search within that field. The below is an example of searching for the term "azure-ip" within the Name field:

The search mode for a column can be configured by right clicking on the input field. A menu will be presented will all of the available options:

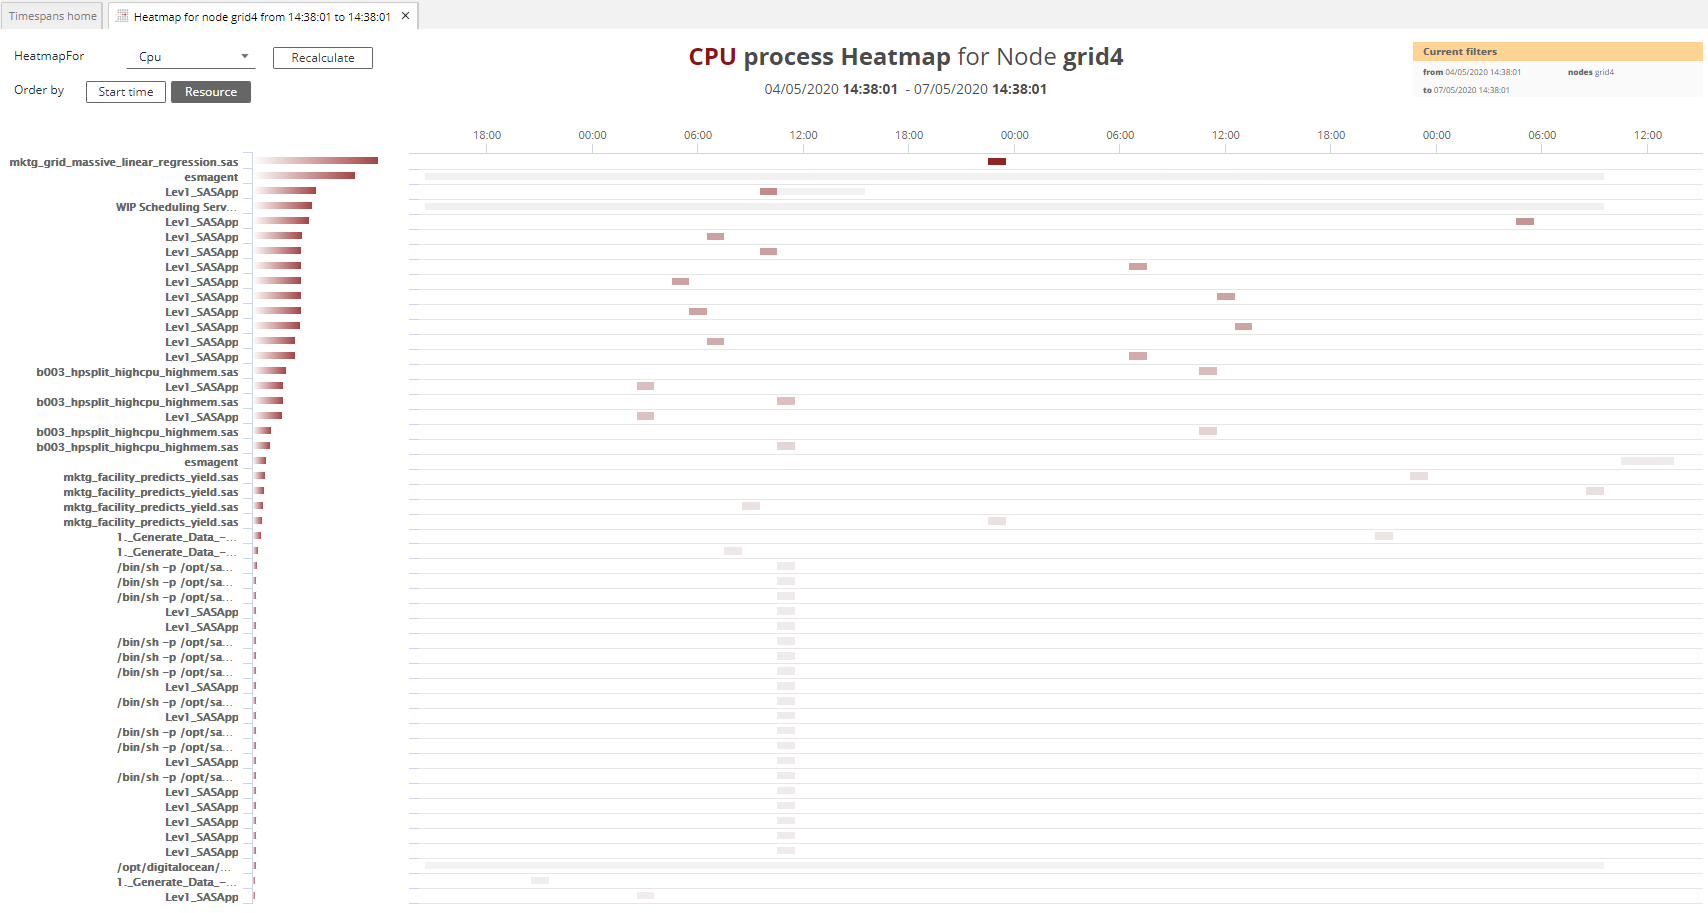
Filtered Selection Heatmap
When Heatmap for filtered selection is selected from the menu a "Top 50 Heatmap" is generated for the processes that are visible in the process list. This functionality allows for comparison of processes across nodes.

Session Portlet
The session portlet shows resource utilization at the process level. The top row of the portlet always has, from left to right, the following components:
- Hamburger menu - This menu allows you to toggle whether the portlet chart legend is visible, to show more details about the process in addition to its name, view any associated log files (requires authentication), and if appropriate, terminate a session (requires authentication)
- Session name - The name of of the process as defined in either the
ESMJOBNAMEenvironment variable, or from theprocessNamecomponent of a filterSpec block. - View shortcuts - Predefined selections of the process metrics to displayed
- Portlet size options - Minimize, restore, and maximize the portlet within the application window
Within the session portlet chart, the X axis shows time, the primary (left) Y axis shows percentages, and the secondary (right) Y axis shows other units including MB (for memory) and MB/s for IO throughput. The following metrics can be seen at the node level:
- CPU - The amount of CPU used shown as a percentage of one (1) CPU core
- Resident memory - The amount of memory that is in use by the process.
- Virtual memory - The amount of memory that the operating system has reserved for the process. For Java processes, this is the
Xmxvalue. - Temp - Work (Only applicable for SAS Foundation (including Workspace, and Batch jobs) and SPRE processes) Shows the size of the total size of a SAS session's WORK area.
- Temp - Util - (Only applicable for SAS Foundation (including Workspace, and Batch jobs) and SPRE processes) When configured, shows the size of a SAS sessions' UTILLOC.
- CAS Cache - Resident - (Only applicable to SAS CAS processes) The in-memory size of the Cache
- CAS Cache - Total - (Only applicable for SAS CAS processes) The total size of the CAS cache being used but the process
- Disk Read - The speed, in MB/s, that the process is reading from the IO subsystem
- Disk Write - The speed, in MB/s, that the process is writing to the IO subsystem
- Major Faults - The number of Major Faults since the last measurement
- Minor Faults - The number of minor faults since the last measurement
- Threads - The number of threads that the process has opened

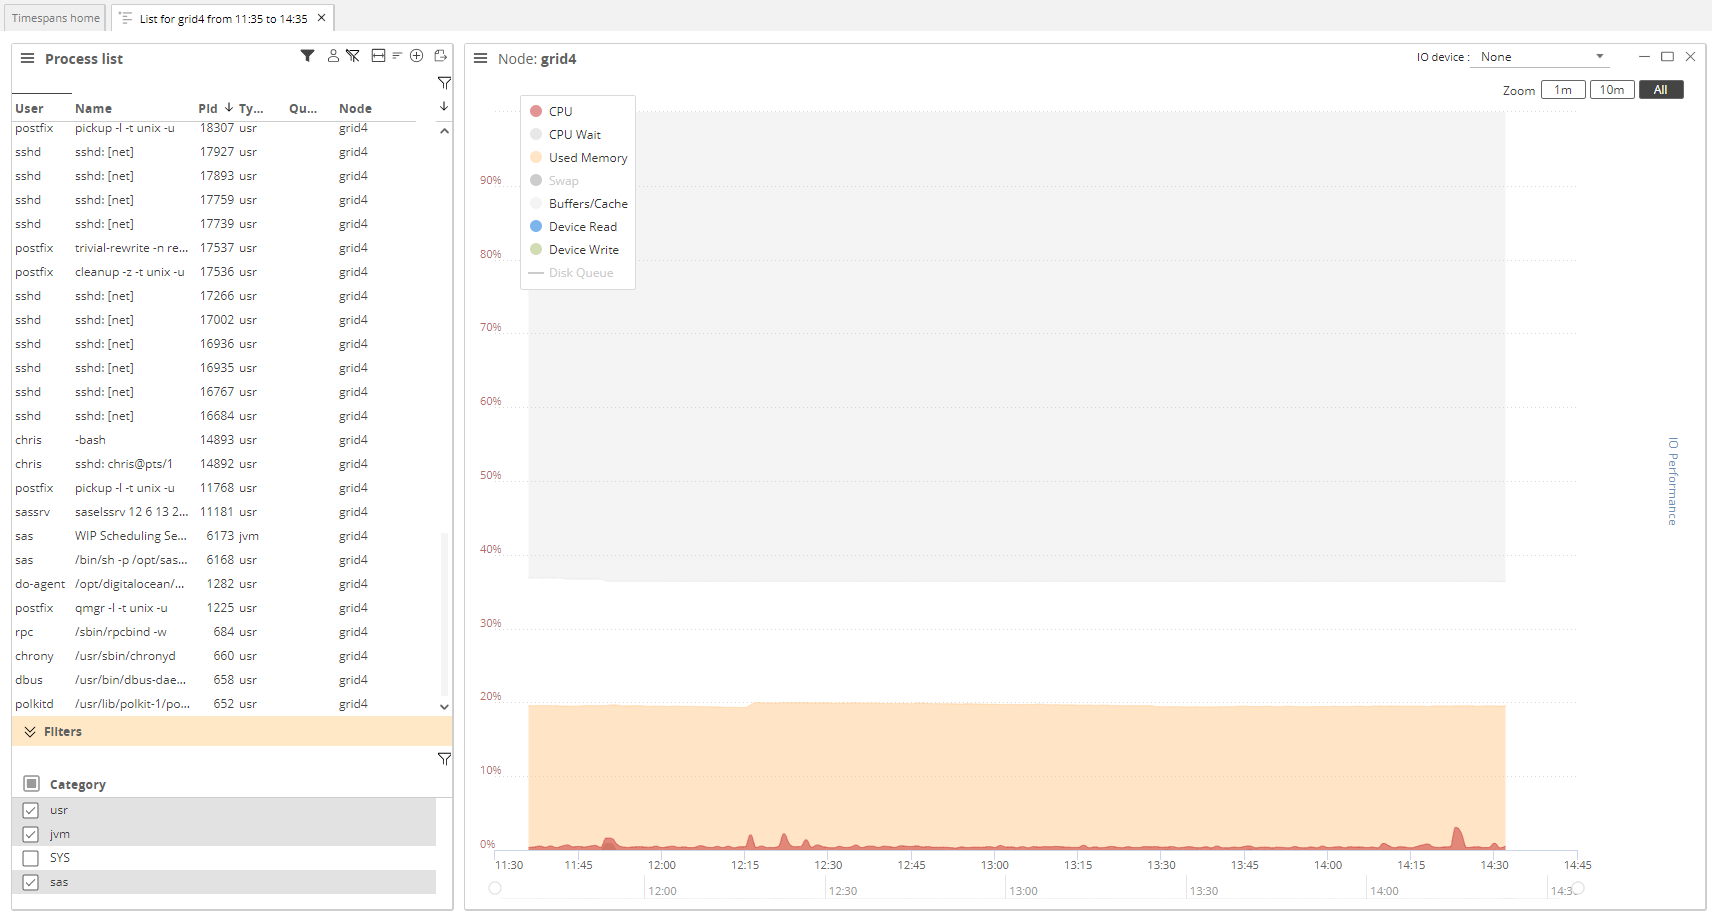
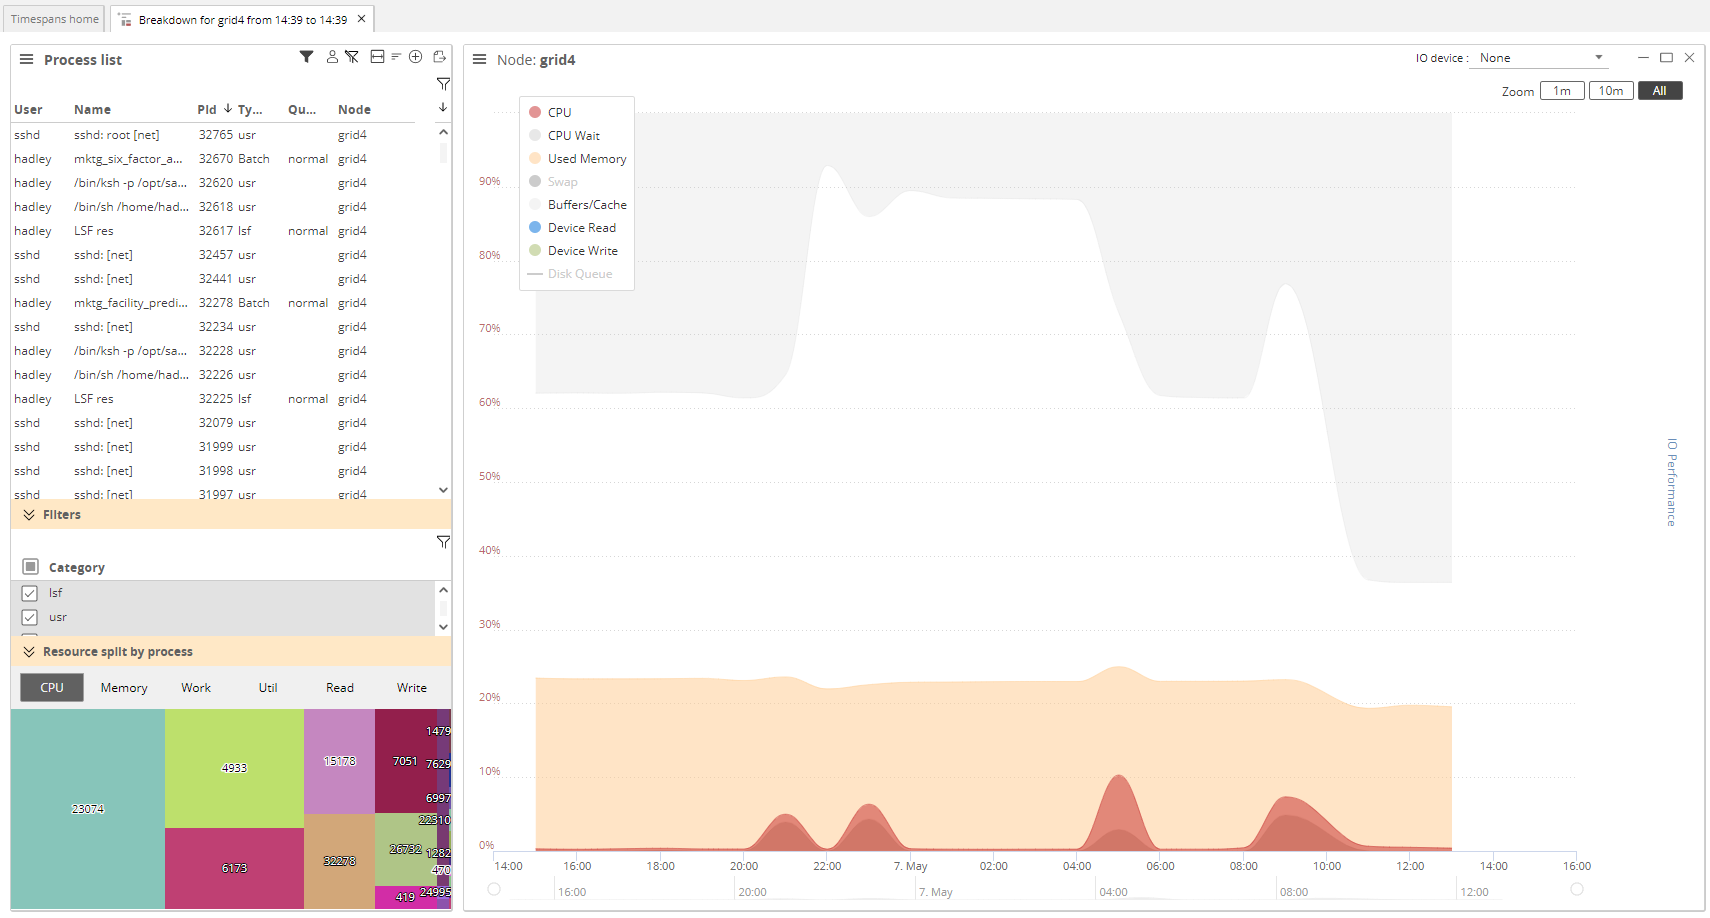
Node Portlet
The node portlet shows resource utilization at the node level. The top row of the portlet always has, from left to right, the following components:
- Hamburger menu - This menu allows you to toggle whether the portlet chart legend is visible and allows for exporting of the chart to various file formats
- Node label - Shows the name of the node
- IO device - This is a drop down menu of discovered or configured IO devices including disks and network devices
- Portlet size options - Minimize, restore, and maximize the portlet within the application window
Within the chart, the X axis shows time, the primary (left) Y axis shows percentages, and the secondary (right) Y axis shows device throughput in Megabytes per second. The following metrics can be seen at the node level:
- CPU - The percentage of overall CPU utilization.
- CPU Wait - The percentage of overall CPU wait.
- Used Memory - The amount of "physical" memory used
- Swap - The amount of virtual memory used (physical + swap)
- Buffers/Cache - The amount, in MB, of physical memory that is being used by the operating system as cache for speeding up file-system operations.
- Device Read - The throughput, in MB/s, being read from the selected IO device
- Device Write - The throughput, in MS/s, being written to the selected IO device
- Disk Queue - The length of the disk queue for the selected IO device

The Live View menu

-
A List of all Active sessions is a simple list of all processes active during the visible time window. It allows individual processes to be filtered by name, and their timelines shown. It is often the fastest view to load.
-
The Top 50 Heatmap will show the top 50 processes consuming a selected resource on the currently selected hostname. By default this shows the CPU utilization but other resource heatmaps are also available. Clicking on a process in a Top 50 heatmap will open the timeseries performance data for that process1.
-
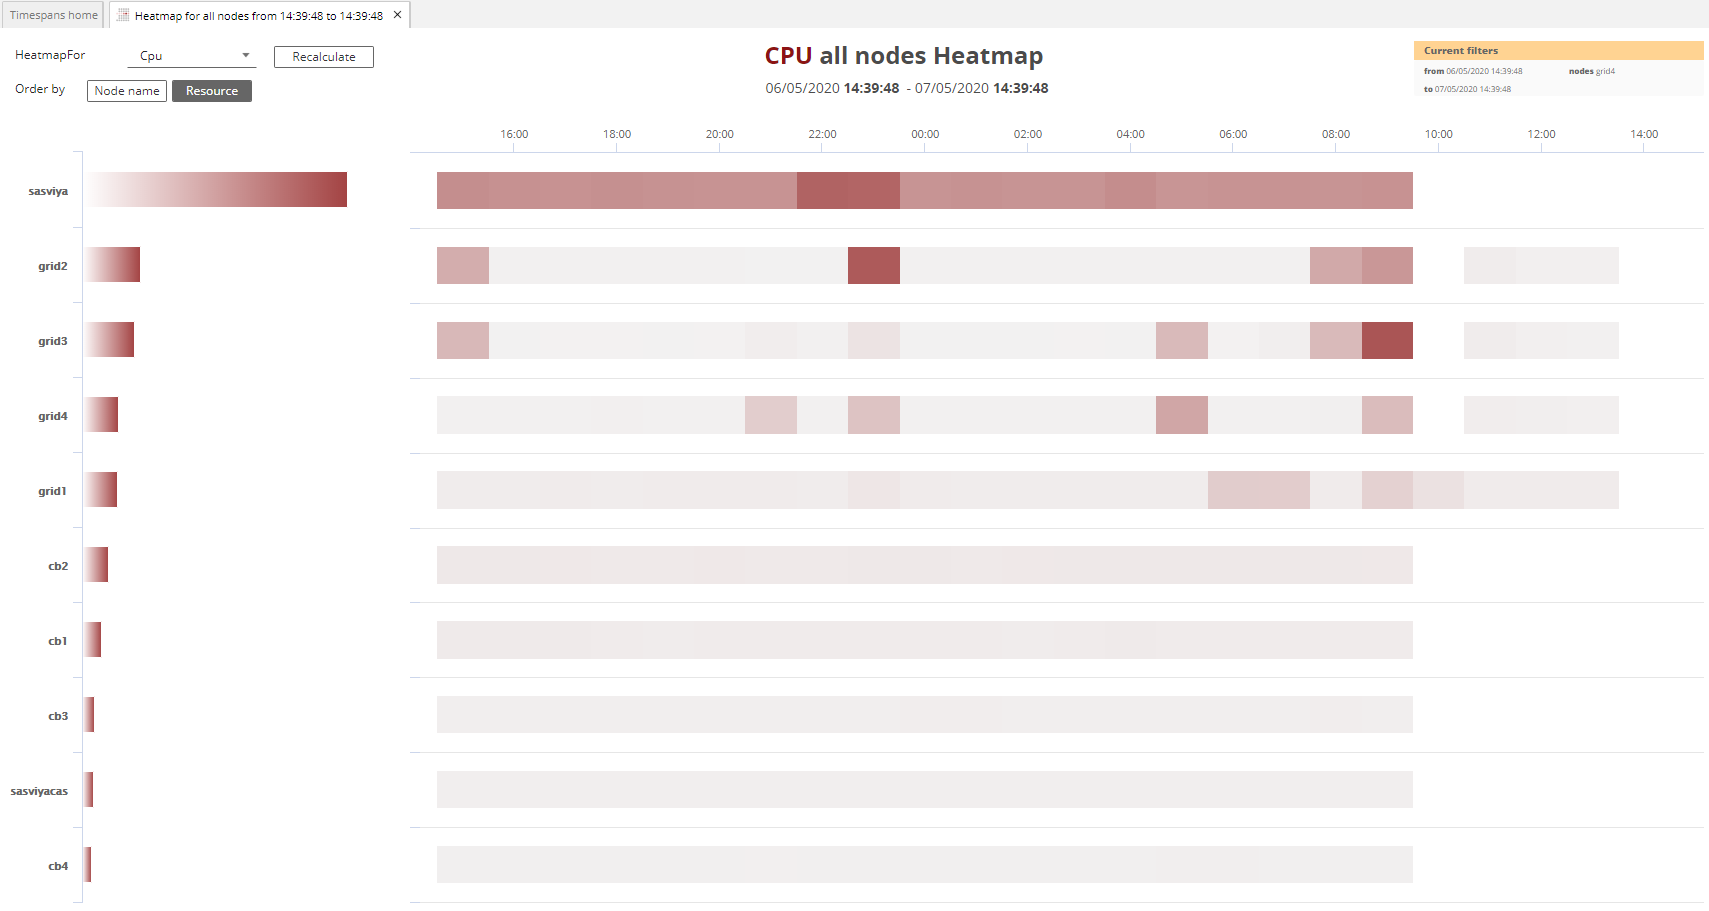
The Node Heatmap is a good starting point for a top-down investigation of issues. Selecting the node heatmap button will create a timespan showing the resources used across all nodes1.
-
A Full Analysis will create a Timespan and provides a comprehensive breakdown of resources used allowing you to select and compare multiple processes side by side.
-
A Job Search will search for all other invocations of a job if the selected process is a job itself.
-
A Distributed Search will find all of the subsessions that are related to the session currently visible in the session portlet.