Basic SAS Enterprise Session Monitor Concepts
Views
Data in SAS Enterprise Session Monitor is presented using a number of Views. Views are opened by clicking on their buttons on the SAS Enterprise Session Monitor Menu. Each view serves a different purpose:
- Live View of the data presents a view of the data which is constantly updated in real time
- Timespans explores the data from the perspective of a segment of time across all activity
- Sessions and Jobs investigates the data from the perspective of a session, Batch Job name, or job name pattern.
- Events and Logs shows tasks, actions, or events that have been generated by sessions
In addition to these, two 'Visual Searches' are available:
- the Job Search presents resulting Batch Job runtimes as a Gantt chart
- the Tag Search visualizes the occurrences of a given Tag or Tag Pattern as a scatter graph.
Both the Views and Searches are discussed in more detail in the next chapter of this document.
Shortcut toolbar
The shortcut toolbar is visible on the Dashboard, Live View, and Timespans views. The shortcuts allows a user to quickly navigate to specific views of the SAS Enterprise Session Monitor data. For all of the shortcuts described below, the consistent filter is the time span that is applied is the time. For example, if you are on the Dashboard looking at the last 60 minutes for a particular server, clicking on the "List all active" shortcut will show you all of the processes that were active, on that server, for the past 60 minutes.

- List all active - Shows a simple, fast listing of all processes active on the selected node or cluster.
- Top 50 Heatmap - Shows a heatmap view of the top 50 resource consuming processes active on the selected node or cluster. By default, this will open a heatmap of CPU consumption where the processes are ordered by their start time in ascending order. This view is a very good for seeing the resource consumption over a large number of processes and the relationship of consumption of resources between them.
- Node heatmap - Shows a heatmap of the top 50 resource consuming nodes. By default, this will open a heatmap of CPU consumption where the nodes are ordered by their name in ascending order. This view is very good for seeing the resource consumption of a large number of nodes and the relationship of the consumption of resources between them.
- Full analysis - Shows a Treemap breakdown of resource consumption for all processes active on the selected node or cluster. This view is very useful for drilling into further details about a process with the ability to compare it to other processes.
- Job search - Shows a Gantt chart view of any jobs that were active during the selected Timespan.
- Event search - Shows a list of all of the captured events (errors, warnings) that have taken place on the selected node or cluster.
Tabs
To make the exploration of data as intuitive and easy as possible, SAS Enterprise Session Monitor uses a tabbed layout. Every time a View or Search is opened, it appears in a new Tab, allowing multiple data views to remain open at the same time.

This allows the user to explore the data non-destructively, allowing them to keep certain steps in their investigation open for later comparison or reference. Tabs can also be renamed, where more meaning is required or desired.
Portlets
Most of the performance data presented through the SAS Enterprise Session Monitor interface is organised into 'Portlets'. Portlets aim to emulate the look and feel of traditional desktop application windows, and some can be resized, rearranged or closed by the user. The different types of portlet used by SAS Enterprise Session Monitor are explained in more detail in later chapters of this document.
List Portlet
This portlet displays a list of all active or recently active sessions. Session filtering and navigation is performed using the List portlet on the left side of the live view.
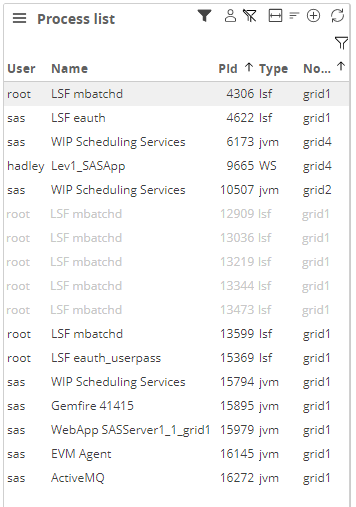
All currently active sessions are listed in the list portlet tree, by default grouped by the node they are currently executing on. The data in the tree is split into four columns 1 showing the following session attributes:
- the user column shows the username under which the session is executing. In addition, the icon represents the session type for that session.
- the name column shows the identifier for that session. This value can vary between session types and depends on chosen configuration options.
- the pid column shows the OS Process ID of the session on the server.
-
the type column shows the session type for a given session. Sessions types are displayed in abbreviated form: PWS stands for Pooled Workspace Session, WS stands for Workspace Session, CS stands for Connect Session, and so on. The sessions shown can vary according to the system type and configuration.
Note: For more information about Session Attributes, see the Session Attributes section of this document.
The List Portlet contains additional panes which facilitate the grouping and filtering of the Session List:
- The Group Sessions By pane
2lets the list of sessions be grouped by type rather than executing node - The Filter Sessions by pane
3can apply a 'team filter' to the session list, so that only sessions owned by certain users are shown. This filter is configured via the 'User Settings' dialog. - The Display Session Type pane
4lets the list of sessions be filtered by session type. By default, all session types apart from System sessions are shown here.
The list of recently active sessions updates automatically every 30 seconds. To force an update, click the Refresh Button 5 on the right side of the portlet title bar.
Session Portlet
The Session Portlet uses a time-series line graph to visualise the performance data of a session.
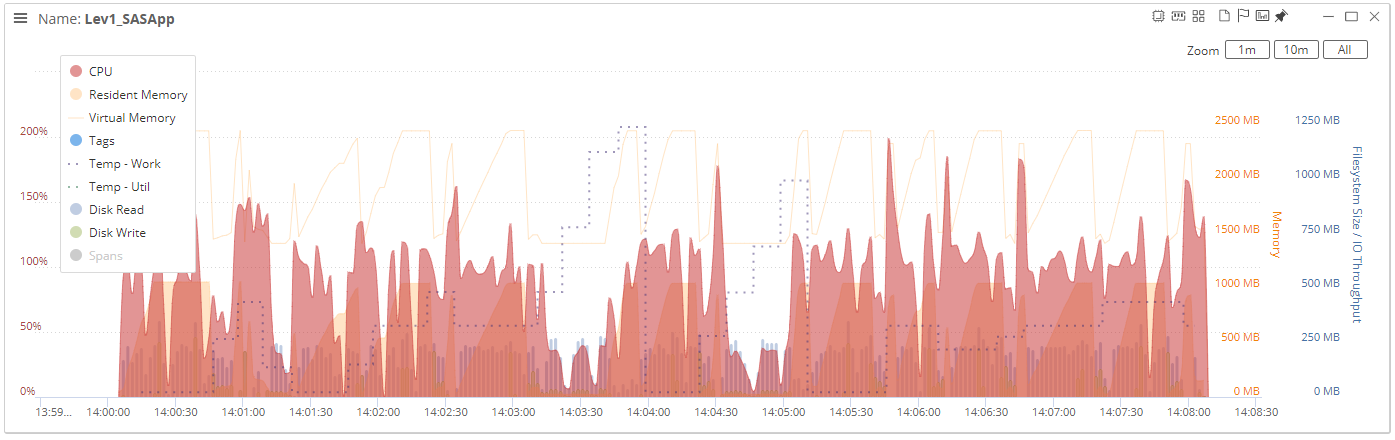
The graph contained in the Session portlet shows the CPU, Memory and Disk space usage for the session chosen from the List portlet. The Disk and Memory measurements are updated at a default interval of two seconds, while the SASWORK and SASUTIL directory sizes are measured at a default interval of 10 seconds.
The data is displayed on the Session Graph as follows:
- CPU consumption is represented by the red area of the graph, with its axis shown to the left of the graph. 100% of CPU usage represents one fully saturated CPU thread. See (section on threads and usage) for more details
- Memory measurements are represented by an orange line, the axis for which is shown to the right of the graph.
- Disk usage measurements are represented by bars and dotted lines on the graph, the axis for which is shown to the right of the Memory axis. Blue dotted lines represent the size of the SASWORK directory, and green dotted lines represent the size of the SASUTIL directory. Blue bars represent the read speed of the session to I/O devices. Green bars represent the write speed of the session to I/O devices.
It is possible to 'zoom' in on the graph by using the mouse to click and drag along the chart to select the timespan of interest. When this is done, the live graph will stop scrolling and the smaller 'Navigator' graph immediately below the main graph will show the area of the graph that has been zoomed into. The handles on the navigator graph can subsequently be used to adjust the zoom level, and the selected area of the navigator graph can be dragged to move the chosen time window while maintaining the same zoom level.
The individual elements of the graph can be hidden by clicking on the corresponding label in the graph legend. The icons on the top right of the portlet also allow it to be maximized or closed.
The 'Last Tag' button at the top right of the portlet (shown as a flag) will search for the last occurrence of a Tag on the selected session, and if one is found, will open a Timespan showing the last occurring tag on that session. For more information about tags, see the section on Tags.
Node Portlet
The Node Portlet uses a time-series line graph to visualise the overall performance of a chosen node.
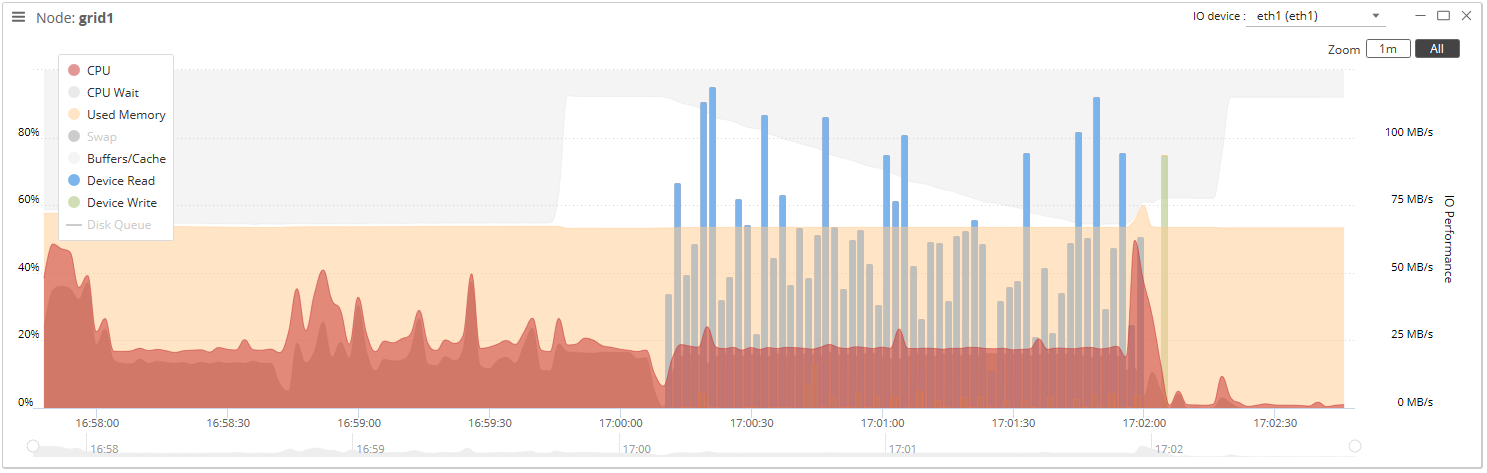
The Node Graph shows the total CPU and Memory consumption for all processes executing on the selected node. It also shows the read and write performance for a chosen storage device. Like the Session graph, this graph is updated in real time, and any data displayed by a session graph is always synchronised to its corresponding node graph.
Data is displayed in the Node graph as follows:
- CPU consumption is represented by the red area
1of the graph, the axis for which is shown to the left of the graph. 100% of CPU usage represents one fully saturated CPU thread. See (section on threads and usage) for more details. - Memory measurements are represented by an orange line
2, the axis for which is shown to the right of the graph. - When a disk device is chosen from the dropdown menu, Disk usage measurements are represented by bars
3on the graph, the axis for which is shown to the right of the Memory axis. Blue bars represent the read speed of the selected disk device, and green bars represent its write speed.
Disk devices are chosen using the dropdown menu (link to image) in the top right of the Node portlet. If no disk device is chosen, the default view does not show any disk device metrics.
Sessions
A 'Session' in SAS Enterprise Session Monitor is any remote (server-side) process which has been started by a SAS server. The most familiar type of this would be a 'Workspace Session', which is a remote process started by SAS, for example when a user uses SAS Enterprise Guide to connect to an application server context such as SASApp to execute their project code. Workspace sessions are just one type of server-side process managed by SAS; common session types include Pooled Workspace sessions, SAS/CONNECT sessions, Stored Process sessions and Batch jobs, among others. While they serve different purposes, all of these different types of remote sessions execute SAS code and compete for resource in the same way.
Each SAS Session that starts is assigned a Process ID number (PID) by the server's operating system. This ID uniquely identifies that process on that server. If the session was started on a multi-server distributed SAS environment, SAS may have picked one of a number of servers (Nodes) to start the session on. All nodes are uniquely identifiable by their hostname.
On the most basic level, this is how all SAS sessions are identified - by a hostname (the name given to the node the session is executing on) and a PID (the ID assigned to the session by that node). However, these alone tell us little about what those sessions are doing and which SAS user they belong to, which is why SAS Enterprise Session Monitor also uses some additional attributes to help identify and track each session.
One of the main attributes that sessions in SAS Enterprise Session Monitor can be grouped or filtered by is Session Type. SAS Enterprise Session Monitor also identifies sessions by their User. For Metadata aware session types such as Workspace Sessions, the user attribute always corresponds to the Metadata Username of the user who started the session; for most other session types the user attribute corresponds to the Operating System user under which that process is executing.
Finally, SAS Enterprise Session Monitor introduces the concept of a Session Name. This is a customisable attribute which can be configured in various ways to help sessions be identified more easily. By default, Workspace and Pooled Workspace session names contain the name of the application server context they are executing on, Batch session names contain the name of the executing batch job, and Stored Process session names contain the number of the port that they are listening on. As SAS Enterprise Session Monitor allows session names to be customised by the administrator, your environment may use a different naming convention to the defaults described here.
Jobs
In SAS Enterprise Session Monitor, a Job is a special, extended type of session that is generally reserved for SAS Batch Jobs, i.e. deployed programs which are executed by a scheduler. In SAS Enterprise Session Monitor, Jobs differ to standard sessions in that:
- Jobs have a Return Code attribute, which denotes whether the job completed successfully, with warnings, or with errors.
- The performance data shown by a Session portlet contains extra highlighting when displaying a Job, in order to make the graphs easier to read.
- Job logs are tracked in real time by SAS Enterprise Session Monitor, and program Warnings and Errors are displayed as part of the performance data
Jobs can be searched separately from other sessions and have a dedicated pane on the SAS Enterprise Session Monitor ribbon. For more information, see the Job View section.
Tags
Not yet available on SAS Viya 4
Currently, the %esmtag() macro is only available on systems that are running SAS9 or SAS Viya 3.x.
Macro quick reference
%esmtag(label=, text=, color=)
Parameters
label: The text to be shown on the time-series charttext: The text to be shown in the mouseovercolor: The background color of the label
Examples
%esmtag(Starting new task);
%esmtag(Created the table &syslast with &obs observations)
%esmtag(SQL EMPTY, The step produced no data, #DDAAAA);
Tags are small, labelled, flags which are displayed on the time-series graph at the time that they occur. Tags can also display extended data when hovered over by a mouse cursor, and their colour can be customised by the user.
Although they are used by SAS Enterprise Session Monitor with other session types, tags are primarily intended as a programming and debugging tool to be used by SAS developers in place of the %PUT statement. Because tags appear on the graph in real time, they can be used to separate different steps in a program when evaluating or comparing performance. For more information about configuring Tags to be automatically created for some SAS clients please see the SAS Enterprise Session Monitor for SAS configuration guide.
Tags can be written to SAS Enterprise Session Monitor by calling the %esmtag() macro. The macro accepts up to three parameters: The flag label, the text to be shown on mouseover, and the colour of the tag. Tags accept some basic HTML tags for line breaks and text formatting, and the colour parameter is expected in HTML format. Only the first parameter is required. If only one argument is supplied, this is set to the tag label:
proc sql;
  create table cars as
    select *
    from sashelp.cars;
quit;

%esmtag(Create work.cars with &sqlobs obs);
 Simple example of SAS Enterprise Session Monitor tags
Some more complex tagging syntax:
proc sql;
  create table cars as
    select *
    from sashelp.cars;
quit;

data _null_;
    set cars end=final;
    if final then
        do;
            if &sqlobs. > 0 then
                call execute('%esmtag(SQL OK, The number of rows read from CARS was '||&sqlobs.||', #AAFFAA)');
            else
                call execute('%esmtag(SQL EMPTY, The step produced no data, #DDAAAA)');
        end;
run;
In this example, the two calls to the %esmtag function would produce a green flag or a red flag on the session graph respectively:
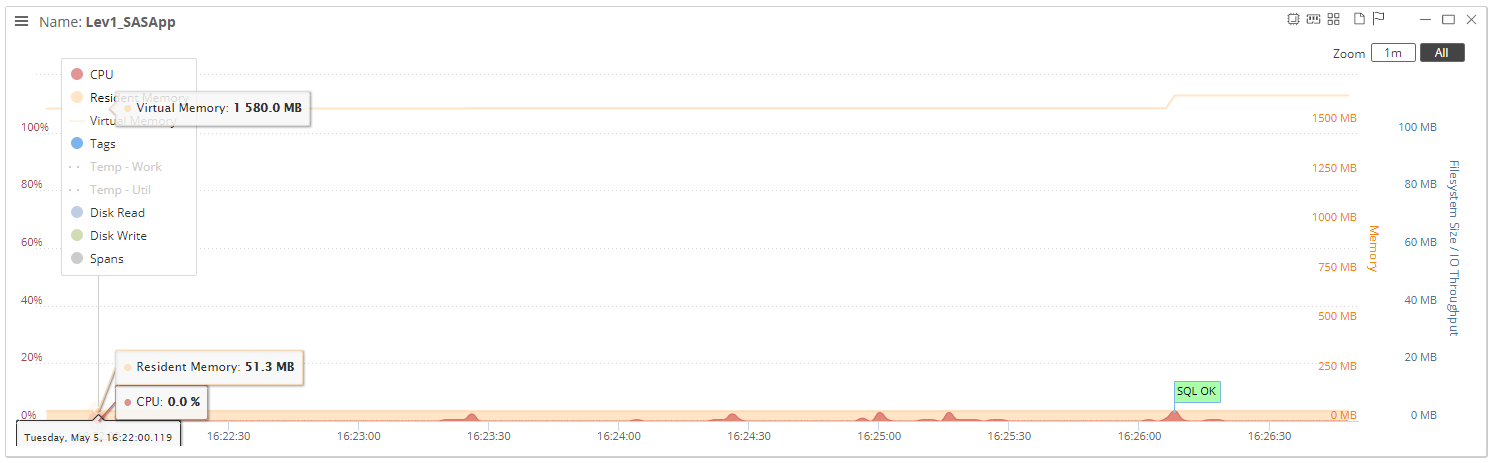
Tags can also be used to communicate runtime information back to the developer, without requiring them to read through the program logs after each execution, or having to wait for the program to finish executing.
SAS Enterprise Session Monitor tags are also easily searchable from the SAS Enterprise Session Monitor front-end. They are designed to be used to quickly locate the performance data for previous executions of a particular project or piece of code. For more information see the Events and Logs section.