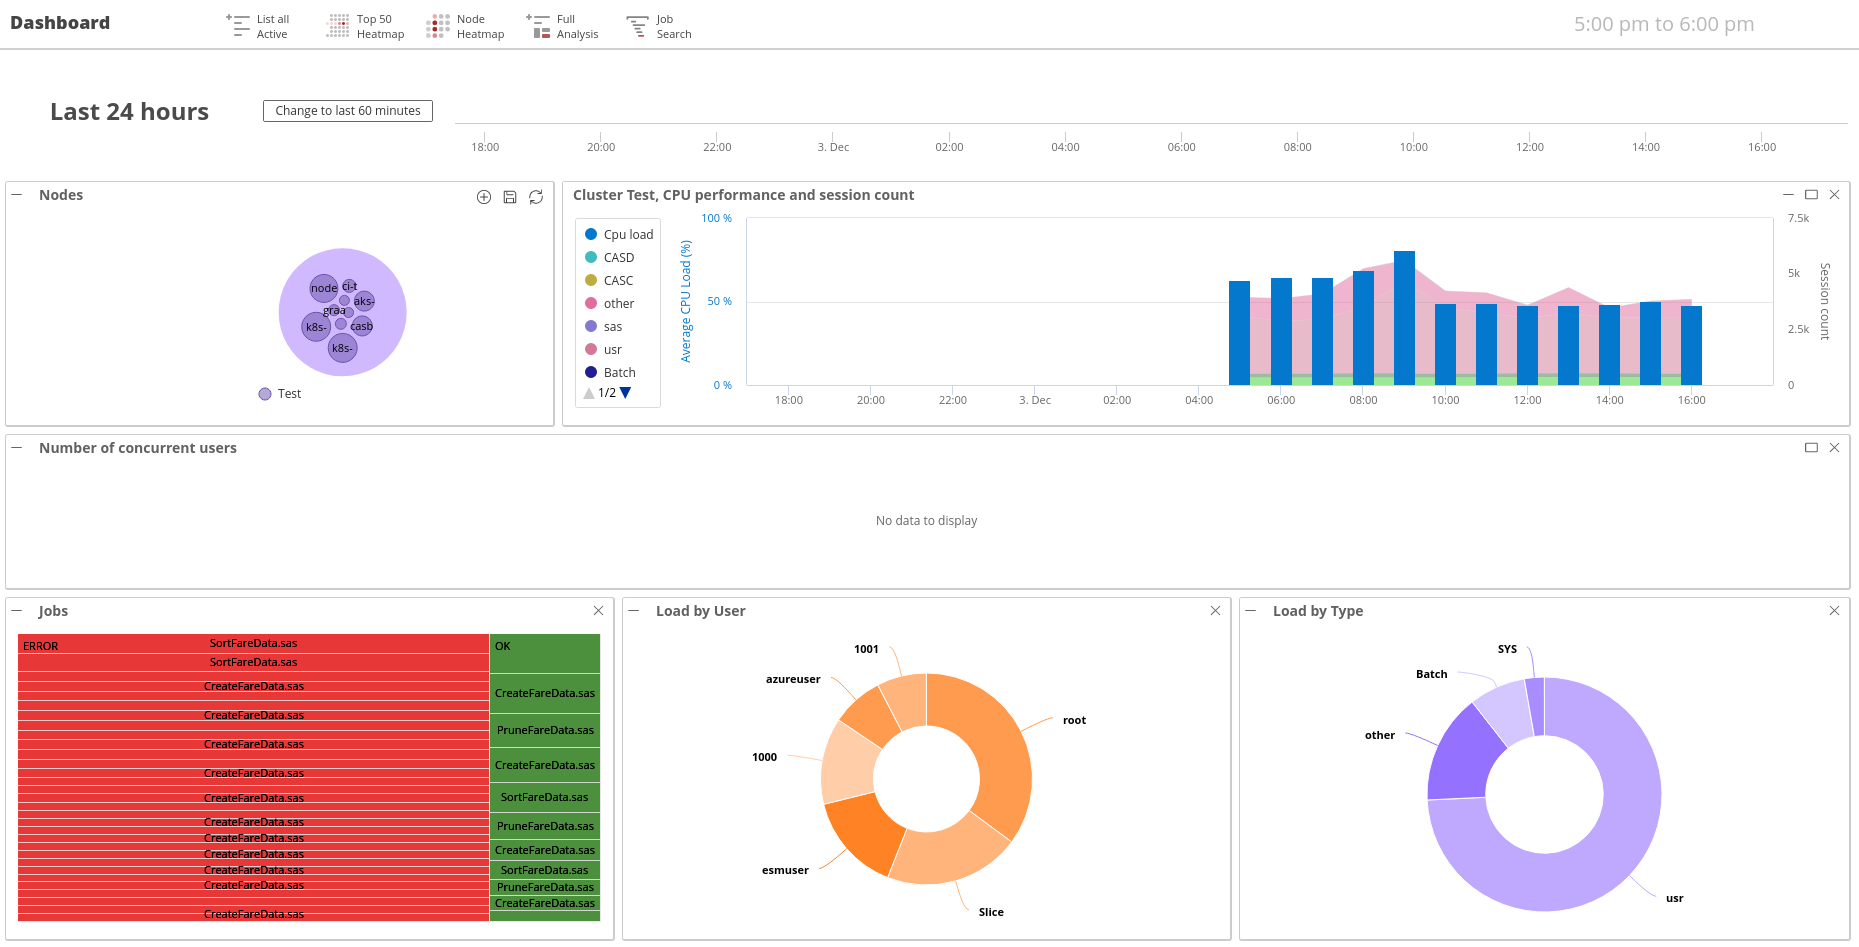
Viewing the Dashboard
Starting with ESM 2020.4 the ESM dashboard has been updated to make it more useful and to including answers to questions we under that a number of ESM users have about their analytic platforms.
Timeline portlet

The Timeline portlet has two main functions on the ESM Dashboard:
- It provides a real-time feed for Errors that are recorded on any node, for any process type, within the environment. Hovering over one of the red error provides high level information on the datetime and node on which the error occurred. Double clicking on the error will take you to a Full Analysis view of the session in which the error occurred.
- It acts as the main Dashboard navigation tool:
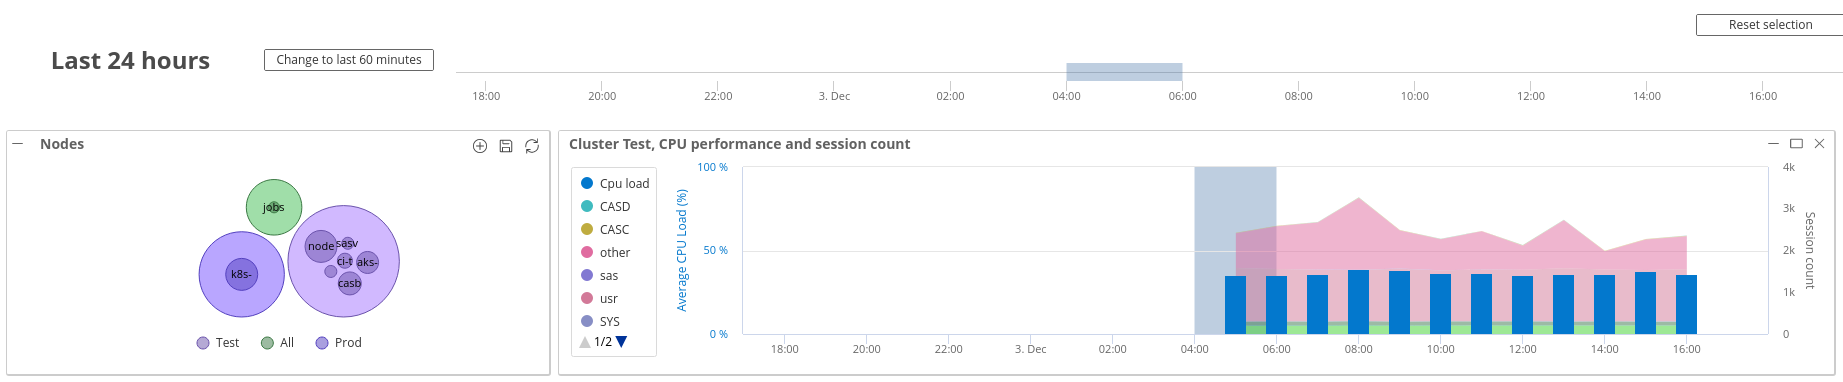
- Changing the time high level time period that is being view: either the last 24 hours or the last 60 minutes.
- Left clicking and dragging on a sub-section of the line, whether in the last 24 hours or last 60 minutes view, will also highlight the same time period on the performance and session count portlet. In addition, the data for the user load, concurrent users, and load by type portlets will all get updated for the time period that has been selected.
Nodes portlet
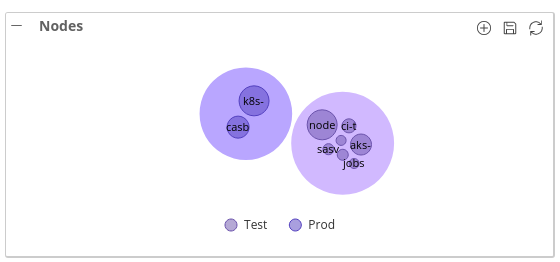
The nodes portlet is, along with the Timeline portlet, another navigation and data filter tool within the ESM dashboard. Selecting a node or a cluster of nodes will dynamically update all of the other charts on the dashboard to include only the nodes selected.
To create a new cluster, click on the plus (+) sign in the top right hand corner of the portlet. Once you have entered a name for your cluster on the dialog that appears, click OK. To add nodes to your new cluster, left-click and drag nodes from one cluster to another. To save your cluster configuration, used the save file icon in the top right hand corner of the portlet.
Note
Only a privileged user with the "settings" capability is able to save clusters.
To delete a cluster use Shift-Left mouse click. You will be prompted with a dialog to confirm that you want to perform this action. To save this deletion, use the Save cluster option in the top right hand corner of the portlet.
Performance and session count portlet
The performance and session count portlet is designed to give an overview of system utilization for the selected time period. CPU utilization, as percentage of available CPU cycles, is shown using blue columns. Session, counts, broken down by type, are shown behind the CPU utilization bars as a stacked area chart.
Using the chart legend, session types and CPU bars can be filtered in or out of the chart. Dragging on the chart along the X axis allows, in the same way as the timeline portlet the time to be filtered.
Note
When in 24 hour view the portlet shows data aggregated hourly. When the portlet is in the 60 minute view the data points that can be seen on the performance and session count portlet are per minute.
Concurrent users Portlet
The concurrent users portlet shows, by session type, the number of concurrent sessions that are running in the selected nodes. The session types here are limited to "user" sessions and are filtered on the ESM session type. The session types included in this chart are:
- WS - Workspace Server sessions
- CMP - Compute Server sessions
- Foundation - SAS Foundation invocations on a SAS9 or Viya environment1
- CS - Connect Server sessions
- Batch - Batch Server sessions
- CASW - CAS worker sessions for MPP CAS deployments
- CASC - CAS controller sessions for either MPP or SMP CAS deployments
- GRID - Sub-sessions of SAS Grid enabled sessions
- python - Python processes
- R - R processes
Jobs portlet
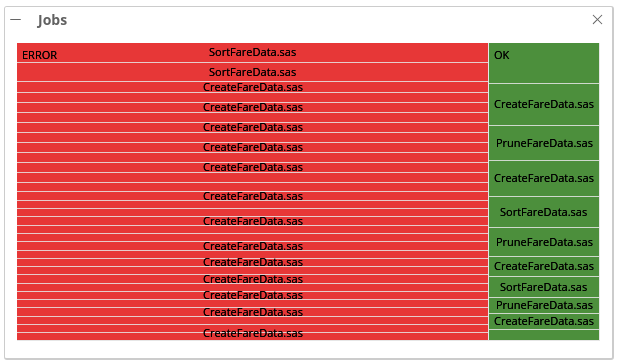
The Jobs portlet shows a Treemap of the jobs that have been executed on the selected node(s) during the period. Job executions are grouped by return code with the size of child nodes based on the runtime of the execution. Clicking on a return code group drills down into just the executions from that group. Clicking on any of the executions from the second level of the chart will take you to a Full Analysis view of that Job execution.
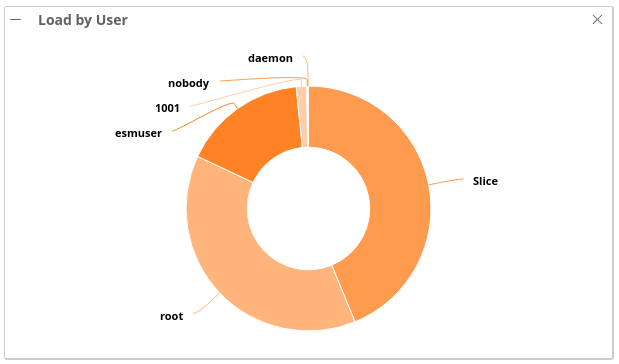
User load portlet
The load by users portlet show a breakdown of the CPU utilization by user for the selected nodes. Hovering over a section of the chart will display a tool tip with the exact utilization percentage.
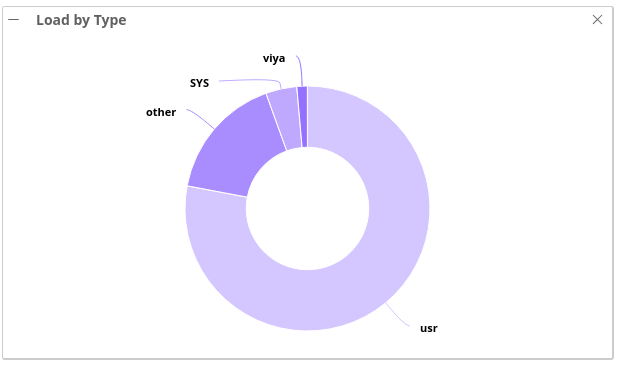
Type load portlet
The load by type portlet shows a breakdown of CPU utilization by the process type. Hovering over a section of the chart will display a tool tip with the exact utilization percentage.
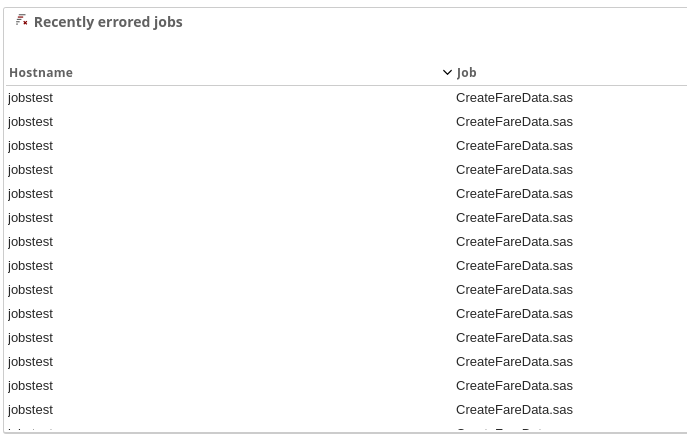
(Optional) Recently errored jobs portlet
Note
This portlet is not visible by default. To enable this portlet, see the dashboard portlets section of the User Settings chapter of the ESM User Guide.
The recently errored jobs portlet displays a list of the 20 most recent jobs that returned with an error. The Job name and the Hostname of the server on which it ran are displayed. Single clicking on any row within the table will take you to a Full Analysis view for the time period of the job.
-
Invocations of SAS that are made outside of a configured server type are resolved as "Foundation" sessions. ↩